The Chart-of-the-Day features two charts. First is a look at the various U.S. market sectors and how they have performed since the S&P 500 Index reached the 2000 mark five years ago. The second chart looks at individual companies that are the “winners” and “losers” over that time-span.
You can access the Chart-of-the-Day report at the following link: … DayChart_071119_RGMP
Bob Weir has over 50 years of investment research and analytical experience in both the equity and fixed-income sectors, and in the commercial real estate industry. He joined eResearch in 2004 and was its President, CEO, and Managing Director, Research Services until December 2018. Prior to joining eResearch, Bob was at Dominion Bond Rating Service (DBRS).
The VIX remains in the “High Volatility” range but closed the week below 30 for the first time since February. U.S. Unemployment Rate is 14.7%, the highest rate since the Great Depression and wipes out all of the job gains since 2000. [more]
The VIX remains in the “High Volatility” range and reversed direction to return above 30. New coronavirus cases remain steady, above 20K/day, and another 2.6 million Americans filed for unemployment claims. [more]
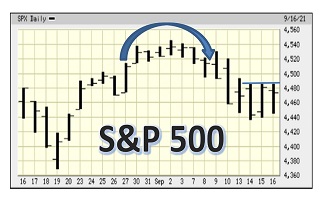
The S&P 500 Index might have reached a near-term peak. The index is struggling to stay above its rising trend-line. It has also experienced a near-perfect, albeit short, “roll-over”. Is this the start of a pull-back? [more]