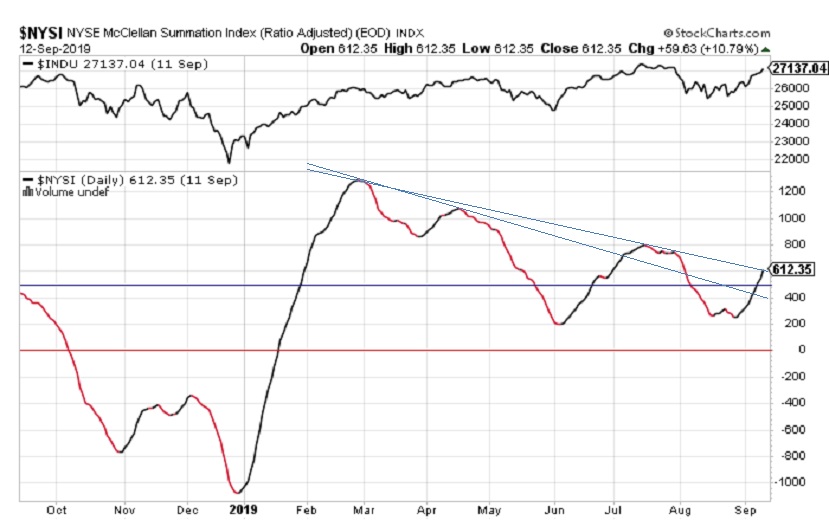
The RASI at the close on Thursday, September 12 is at 612, and continues to rally above the critical 500 level, which denotes the dividing line between Positive and Negative market expectation.
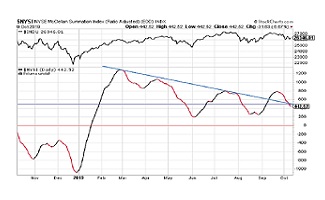
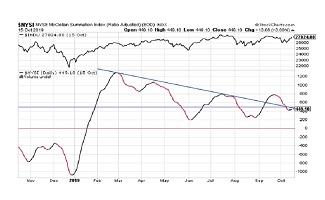
RASI staged a sharp unbroken rally beginning in the last week of December and topped out just under 1300 near the end of February. Since then, RASI has been in decline but it seems to have bottomed in the 200-230 area in June/August.
Its recent rally through the first line of resistance and then above 500 indicates Positive market expectation. However, it has now reached the second line of resistance, which it has to overcome if it is going to signal continued stock market gains.
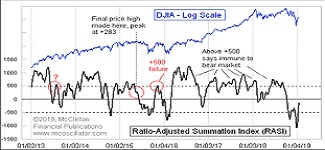
The RASI Index has proven to be a good predictor of where the DJIA will go, as reflected in the top part of the chart where the DJIA is recorded. The DJIA has followed the RASI higher and is now almost back to all-time high levels.
Conclusion
The RASI Index has risen above the benchmark 500 level and is now testing its 2019 primary down-trend line. This could either prove to be important resistance, in which case the RASI Index would retreat, or it could be a significant break-through by RASI, which would portend higher prices for the DJIA.
//
What is the Ratio-Adjusted Summation Index (RASI)?
- The Ratio-Adjusted Summation Index, RASI, is a market indicator developed by Tom McClellan of McClellan Financial Publications.
- A RASI reading that rises to and reaches a specified level (500 and above) can be a signal that a new market up-trend is starting.
- The +500 level is an important dividing line for the RASI, in terms of giving a go/no-go signal about the new up-trend.
- When a rebound in the RASI occurs, but it falls short of getting up to the 500 level, historically that has meant trouble lies ahead.
- But zooming well above 500 is a sign that there is a lot of strength behind the move, and the higher it goes above 500, the more emphatic the message of strength.
- Conversely, a move from well above 500 down to and below 500 is a signal that the market is weakening and that it should move lower.
//