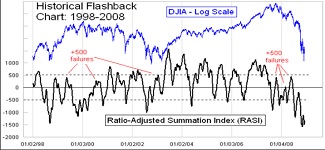
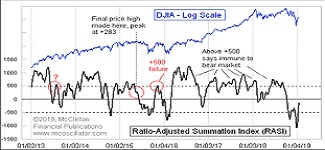
The Ratio-Adjusted Summation Index, RASI, is a market indicator developed by Tom McClellan of McClellan Financial Publications. A RASI reading that rises to and reaches a specified level (500 and above) can be a signal that a new market up-trend is starting. The +500 level is an important dividing line for the RASI, in terms of giving a go/no-go signal about the new up-trend. When a rebound in the RASI occurs, but it falls short of getting up to the 500 level, historically that has meant trouble lies ahead. But zooming well above 500 is a sign that there is a lot of strength behind the move, and the higher it goes above 500, the more emphatic the message of strength. Conversely, a move from well above 500 down to and below 500 is a signal that the market is weakening and that it should move lower. this is possibly happening right now.
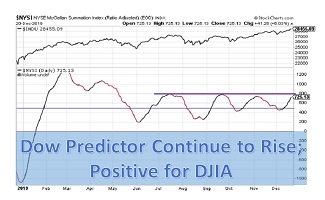
After the dramatic fall yesterday in market indexes, the RASI came in at 578, which is still above “500”, the point above which indicates positive market expectations. But the trend is down and the latest support line did not hold.
You can access this week’s RASI Report here: … … McC_RASI_080619