Current RASI Reading: 477 ►Market Outlook Negative; Trend Negative
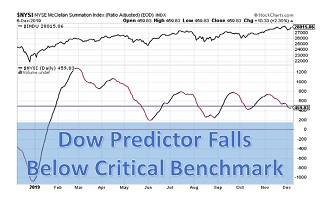
The RASI at the close on Wednesday, August 7 is at 477, and is back below the 500 benchmark that measures whether there is a Positive or Negative expectation for the market. The Index needs to be above 500 in order to generate a Positive market expectation.
If positive A-D (Advance-Decline) numbers keep occurring every day, then that results in continued positive readings, and a continued rise in the Summation Index. Conversely, as the A-D line declines, the Summation Index declines, and the outlook for the market begins to dim.
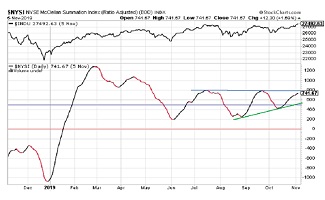
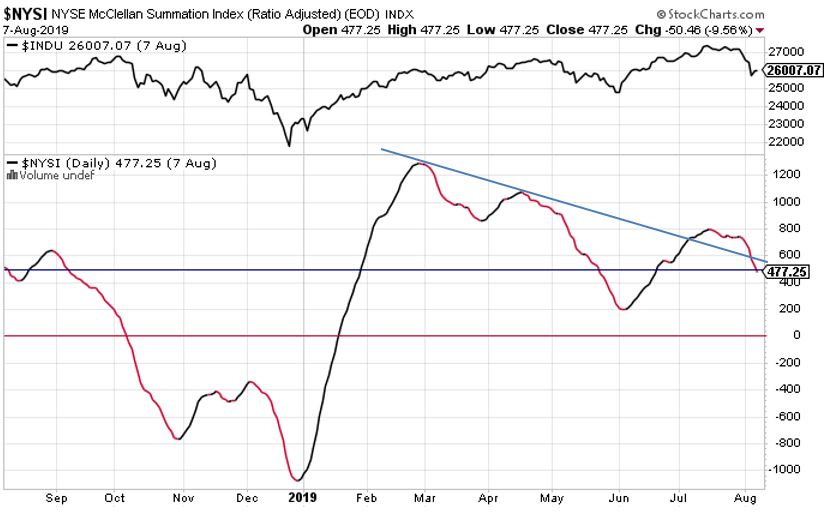
As shown in the chart below, from the lows of last December, RASI rose consistently until the last week of February when it rolled over. The subsequent decline took the Index below 500 in mid-May, but it rallied back above 500 in mid-June. After briefly rising above its down-trend line at the beginning of July, this down-trend line failed to act as support, and the Index has once again fallen below it. The Index has experienced a falling trend since the middle of July and now has declined below the 500 benchmark. This is ominous, because the RASI Index has proven to be a good predictor of where the DJIA will go. This is shown clearly in the DJIA price movement at the top of the chart.
Conclusion
Currently, the A-D line is downwards trending, with lower highs occurring. The Index has broken below this down-trend line, a negative sign. Further, and most importantly, the Index has declined below the “500” yardstick that demarks Positive from Negative expectations for market direction.
Link To The RASI Chart
If you want to watch the RASI for yourself to see how it performs relative to the +500 level, then you can follow it at this link: HERE
________________________________________________________________________________________________
What Is The Ratio-Adjusted Summation Index (RASI)?
A reading on the Ratio-Adjusted Summation Index (RASI) that rises to and reaches a specified level (500 and above) can be a signal that a new market up-trend is starting. Conversely, a move from well above 500 down to and below 500 is a signal that the market is weakening and that it should move lower. A downward corrective move in prices could take the RASI down close to zero or even below.
The Summation Index changes each day by the value of the McClellan Oscillator. If the Oscillator is positive, the Summation Index moves up. If the Oscillator is negative, it moves down. The up or down increments equate to the value of the Oscillator. Thus, a number of positive Oscillator readings mean that the Summation Index (or RASI) moves higher.
The +500 level is an important dividing line for the RASI, in terms of giving a go/no-go signal about the new up-trend. When a rebound in the RASI occurs, but it falls short of getting up to the 500 level, historically that has meant trouble lies ahead. But, zooming well above 500 is a sign that there is a lot of strength behind the move, and the higher it goes above 500, the more emphatic the message of strength. If the RASI moves below 500, then market weakness is anticipated.
You can learn more about RASI HERE
Disclosure
Information for the RASI Report is sourced from McClellan Financial Publications, authored by the widely-respected Tom McClellan.
Tom McClellan has done extensive analytical development pertaining to the stock and commodities markets. He has fine-tuned the rules for inter-relationships between various aspects of financial markets to provide leading indications for important market and economic data.
You can learn more about Tom McClellan and his McClellan Financial Publications website at the following link to the Home Page: HERE