This week, the RASI came in at 257, which is down from last week, and well under “500”, the point below which indicates negative market expectations.
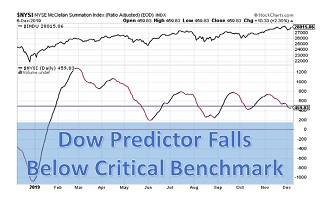
The Ratio-Adjusted Summation Index, RASI, is a market indicator developed by Tom McClellan of McClellan Financial Publications. A RASI reading that rises to and reaches a specified level (500 and above) can be a signal that a new market up-trend is starting. The +500 level is an important dividing line for the RASI, in terms of giving a go/no-go signal about the existing trend. Conversely, a move from well above 500 down to and below 500 is a signal that the market is weakening and that it should move lower. This continues to be the case now.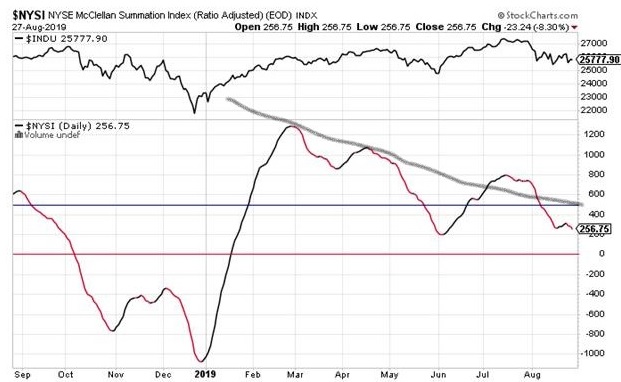
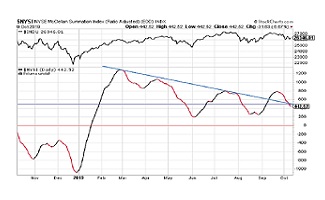
Conclusion: Currently, the A-D line is downwards trending, with lower highs. The Index broke below this down-trend line in early August and, at about the same time, also beneath the benchmark 500 level, below which denotes Negative market expectations. It seems to have stopped its free-fall, at least for now.