You can download the Chart-of-the-Day report at the following link: … DayChart_031819_RGMP
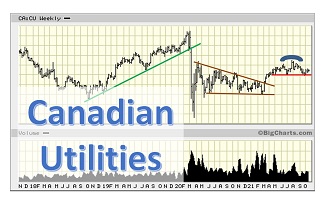
Chart-of-the-Day
Chart of the Day – Canadian Utilities Limited
Canadian Utilities has an attractive dividend yield and also some appreciation potential from current levels. [more]

Tech Talk
Tech Talk: Market Analysis – Friday, February 15, 2019
eResearch is pleased to provide Tech Talk, which is a professional and insightful technical analysis newsletter that comments on interesting chart patterns and pertinent technical action of North American equities. See, also, its sister publication, Equity Clock, also published, with permission, on this website. [more]
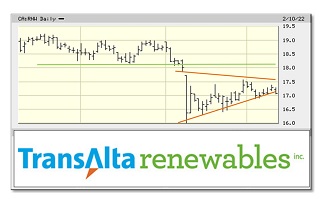
Chart-of-the-Day
Chart of the Day – TransAlta Renewables
Shares of companies in the renewable energy space have been under pressure lately as they are expected to be negatively impacted by rising interest rates. We believe that the share price declines have been overdone, and that long-term recovery prospects are attractive. We highlight TransAlta Renewables (TSX: RNW) in this report. [more]