Note: This article was originally posted on LinkedIn on June 20, 2021, by Gregg Carlson and is reprinted on eResearch.com with permission from the author.
I recently attended the Benzinga virtual cannabis conference. It was two days long and included presentations by public companies and industry experts who told their stories and discussed the industry as a whole. The presentations were both historical and forward-looking in nature and covered the major issues in the industry.
The conference included both public Canadian and U.S. companies and covered the major industry segments. Outlined below is a summary of key future trends in the industry based on the topics discussed and my personal viewpoint.
Background and History
In what I call the cannabis 1.0 period during 2017 and 2018, the U.S. industry was is in a land grab phase as public companies snapped up licenses and private operators that in many cases by 2019 appeared to be at excessive valuations. Public companies were valued on an EV/revenue basis and getting big was more important than making money.
The game of musical chairs was on until the music stopped in 2019 when the public markets woke up and focused on EBITDA. MedMen was the national poster child for this period as MedMen was better at raising money than making money. The investor community shut off MedMen and the rest is history.
In 2019 and 2020 the industry went into cannabis 2.0 mode as the capital markets continued to focus on geographic expansion and EBITDA performance. Fear set in when covid-19 emerged and initially disrupted business until it became obvious that stay-at-home orders and the shutdown of the U.S. stimulated cannabis consumption.
In 2019 and 2020 the largest and leading companies in the industry emerged as multi-state operators (MSOs). The MSO’s benefitted from economies of scale, lower capital costs/sophisticated investor activity, expansion into the major/most lucrative existing markets plus expected recent new markets (based on November 2020 voting outcomes in the U.S.), and strong year-over-year results in Q4/2020 and Q1/2021.
They now dominate the industry with four companies having by far the biggest market caps. They are Cresco Labs (CSE: CL | $3.9B market cap), Curaleaf Holdings (CSE: CURA | $9.4B market cap), Green Thumb Industries (CSE: GTII | $6.2B market cap), and Trulieve Cannabis (CSE: TRUL | $4.0B market cap). The results of the U.S. November 2020 elections increased stock prices/market caps due to the probability that favorable federal cannabis legislation would occur followed by stock price decreases as the likelihood of passage diminished in 2021. See the stock price chart below:
FIGURE 1 – Major MSO Stock Price 11/1/2020 – 6/21/2021

As we look forward from late June 2021 into the future, my opinion of future industry trends is as follows:
1) The industry has consolidated and will continue to do so.
The top four biggest U.S. MSO’s have a combined market cap of approximately $21.8B which is approximately one-half of the entire capitalization of the top 28 U.S. listed public cannabis companies.
It is hard to see these individual companies being knocked off the leader board unless they are combined with a significant non-cannabis company or combined with each other. It is not hard to see further industry consolidation by these or other companies due to economy of scale advantages, significantly lower capital costs, increased attractiveness for institutional investors, and overall credibility for regulators in states granting new licenses. Public cannabis companies will have to consider where they will likely exist and end up within the industry ecosystem looking ahead.
2) Regulatory trends will remain favorable as additional states legalize cannabis. At the federal level, the big issues are the removal of commercial banking restrictions, adoption of interstate commerce, and eliminating 280E tax calculations. My guess is that these barriers will remain in place for a while until they are eventually relaxed or eliminated altogether. This would be a huge positive for the U.S. industry that could significantly increase valuations and capital flow into the industry. At the state level, positive regulatory and legalization trends will continue.
3) Consumer packaged goods (CPG) and branding will become significantly more important when cannabis can be sold across state lines. Interstate commerce as a driver of CPG branding/marketing and a much bigger national market is a game-changer. To grow cannabis in one state and sell into other states will have a profound impact on the industry and company valuations. The largest MSO’s and dominant producers are preparing for this day to eventually come.
4) In connection with the onset of interstate commerce, parts of the industry swing to an anti vertical mode and adjusts in the opposite direction. And to a great degree producers with cost-effective products and successful brands win the national market to sell across state lines followed by eventually selling directly to consumers. Select producers are incentivized to move toward cost-effective fully automated production processes that bring the industry to an advanced level which creates winners and losers who can or cannot compete as budget or premium quality producers.
5) In connection with 4) above, the industry becomes more specialized with select companies focusing on the retail business as high tech retail digitized specialists, while growers/extractors focus on production/interstate-intrastate sales and niche players operate in support roles. As a result, select assets change hands from vertically integrated players to operators who can create more value as a specialist in the asset class as asset divestitures mitigate/cure negative net present value investments for sellers while potentially creating value (i.e. positive NPV) for buyers.
6) The value of dispensaries and other direct-to-consumer sales channels is determined by the value of customers as focus moves away from the number of orders and ticket size per day in a dispensary to focusing on the value of customer-based relationships for corporate valuation and management purposes. We know that an investment is attractive when the present value of inflows exceeds outflows and this concept applies whether we are attempting to value a dispensary, a manufacturing plant, a sales channel, or a customer who transacts with a firm. This concept addresses the cost to acquire a customer and the present value of the cash flows that a customer generates while engaged with a firm.
The present value of the cash flow here is a function of sales, costs, and longevity. This customer-based valuation model links customer economics directly to corporate value. This model allows for companies to assess the expectations for customer value that are embedded in the company valuation and addresses the impact of churn which also provides significant insight into the competitive position of the firm.[1]
7) The valuation described above is based on a redefined realistic view of the available total addressable market to the firm (i.e. dispensary/production-related assets, sales channels, brand value, and/or customer value as a unit of measure).
8) The industry moves to a cannabis 3.0 mode where capital providers look for and expect MSO’s, dispensary operators, producers, and specialists to generate ROIC (return on invested capital) in excess of WACC (weighted average cost of capital) as opposed to focusing on revenue growth, EBITDA, and EBITDA growth. Companies who invest capital that generates ROIC in excess of WACC over time will generate positive returns for their investors and win in the capital markets. Over time they will dominate the industry and eliminate participants who do not focus on ROIC vs. WACC as capital allocators.
Many public companies in the cannabis industry do not currently achieve this. As the industry matures and the race for new markets eventually slows, sophisticated investors will expect this. The best capital allocators in the industry will win by putting their chips on the bets with the most favorable ROIC prospects relative to WACC.
SUMMARY
The industry is dominated by the big four MSO’s and will continue to be. These companies have emerged from cannabis 1.0 and 2.0 as the industry leaders. They benefit from access to the lowest cost of institutional capital, scale, proven management talent, track records, strong balance sheets, and licensing credibility, among other factors.
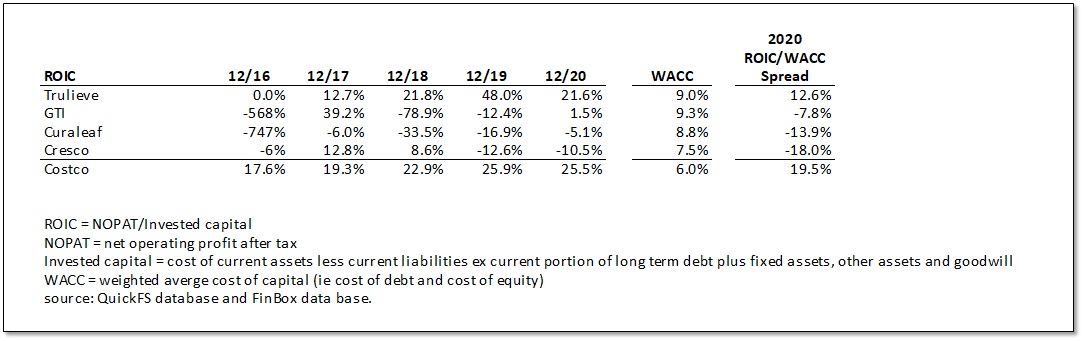
They are generally viewed as skilled capital allocators. In terms of ROIC, GTI posted a positive number in 2020 for the first time in its history while Trulieve has posted superb best in the industry ROIC and a positive ROIC/WACC spread between 2017 and 2020 in an industry where positive ROIC is somewhat rare.
With the Harvest merger, we will see over time if Trulieve can mimic its Florida performance outside of the state. We believe there is a chance they can do this due to their cluster approach to store development, long-term customer relationship-retention strategies, complementary skill set, and non overlapped nature of opportunities for both companies.
We also compared MSO ROIC performance to Costco (NASDAQ: COST), a large well-known consumer-facing retailer that has consistently produced a strong positive ROIC due to a defendable moat that has driven consistent significant growth in cash flow and equity value for several decades. We are in the early stages of cannabis industry growth so it is too soon to tell if a similar pattern will play out in the MSOs over the next several years. But we are hopeful it will. So far Trulieve has exhibited this characteristic between 2017 and 2020 due to its dominance in Florida. See the chart below :
FIGURE 2 – Major MSO ROIC, WACC, and ROIC/WACC Spread
I also present ROE performance data of the four major MSOs based on a DuPont ROE model to provide insight into how the MSOs have derived returns on their capital and in particular how Trulieve has produced outstanding returns on its capital base and outperformed its major MSO peers and many/most other companies in the industry. More specifically, Trulieve has outperformed its MSO peers on ROE performance by achieving both higher turnover ratios and profit margins (i.e. superior asset turnover x superior margins equals superior ROA and ROE). Superior ROA/ROE performance allows a company to require less external debt or equity capital to fund its sales growth and required balance sheet expansion combined with a positive cost of capital spread creates value for existing equity investors. See the chart below for a general outline of ROA and ROE calculations.
FIGURE 3 – ROA ROE and Sustainable Growth Rate

See the table below and comments on the right side of the table that compares Trulieve’s performance to its peers in key ROA/ROE sub-components.
FIGURE 4 – MSO DuPont ROE Deconstruction Based on Relevant Operating Performance

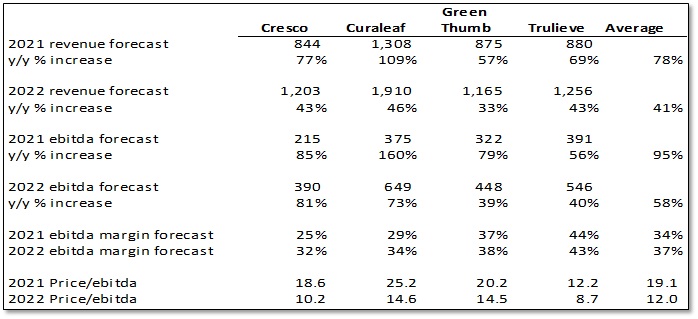
FIGURE 5 – Major US MSO Revenue, EBITDA, and Margin Forecast 2021 and 2022 ($’s in millions)
Please note that I am not making an investment recommendation here or in this report as a whole. Please see the attached disclosure statement below.
Disclosure and terms of use statement
The analysis and opinions expressed in this report reflect the personal view of the author. This report is not a solicitation to buy or sell securities. No part of the author’s compensation was directly or indirectly related to specific recommendations or views expressed in this research report. Readers should consider this report as only a single factor in making investment, business and/or economic decisions. As the author-we are not your advisor the author-we do not take responsibility for any action you take based on this report. This publication is provided to you for information purposes only. The views in this publication are those of the author and are subject to change, and the author has no obligation to update the opinion or information in this publication. The author does not accept liability for any direct or indirect losses arising from the use of this publication or its contents. The author recommends that readers of this report consult with any personal advisors they deem necessary before taking any actions based on this report. Actual results may and are likely to be materially different than those indicated in this report. The author-we have received no compensation from the companies mentioned in this report and do not have an economic and/or advisory relationship with any companies mentioned in this report. The author-we may or may not own shares in any of the companies mentioned. The author does not provide tax or financial advice and nothing contained herein should be construed to be tax or financial advice. Please note that this report was originally prepared for and issued to approved market professionals, professional advisors, and specific client relationships. Recipients of this report who are not designated recipients should not use its contents, take action based on its contents and/or redistribute the report. This report should not be relied on as a substitute for the exercise of independent judgment. We believe the information and opinions included in the report are complete and accurate. Information and opinions included in the report were obtained from sources that we believe are reliable. We make no representation as to their accuracy or completeness. We accept no liability or loss arising from the use of the material presented in this report. The information presented in this report is provided to you for information purposes only and is not considered as an offer or the solicitation to sell or to buy or subscribe to securities of other financial instruments. We will not treat report recipients as its customers by virtue of receiving this report. This report and its contents may not be altered, transmitted to, copied, or distributed to any other party, without prior express written permission of the author. You may not reproduce, distribute, transmit, disseminate, sell, publish, display, broadcast, circulate or forward any part of this report to anyone, including but not limited to others in the same company or organization, without express written consent of the author. This requirement and limitation includes, for example, electronic activities such as emailing, scanning, website posting, downloading, printing, photocopying, faxing, and the like. Authorized recipients may print a single copy (not multiple copies) solely for their own personal use. No other copying of any kind is authorized.
[1] Michael J. Mauboussin and Dan Callahan CFA, “The Economics of Customer Businesses,” Morgan Stanley Centerpoint Global Insights, May 19, 2021