eResearch | For some time now, we have been expecting a market pull-back. However, some aspects of the market continue to defy the odds. In this month’s report, we are going to provide 3-month charts of the major Canadian and U.S. market indexes, with some surprising results.
We will look at four key U.S. indexes and one Canadian.
S&P 500 Index
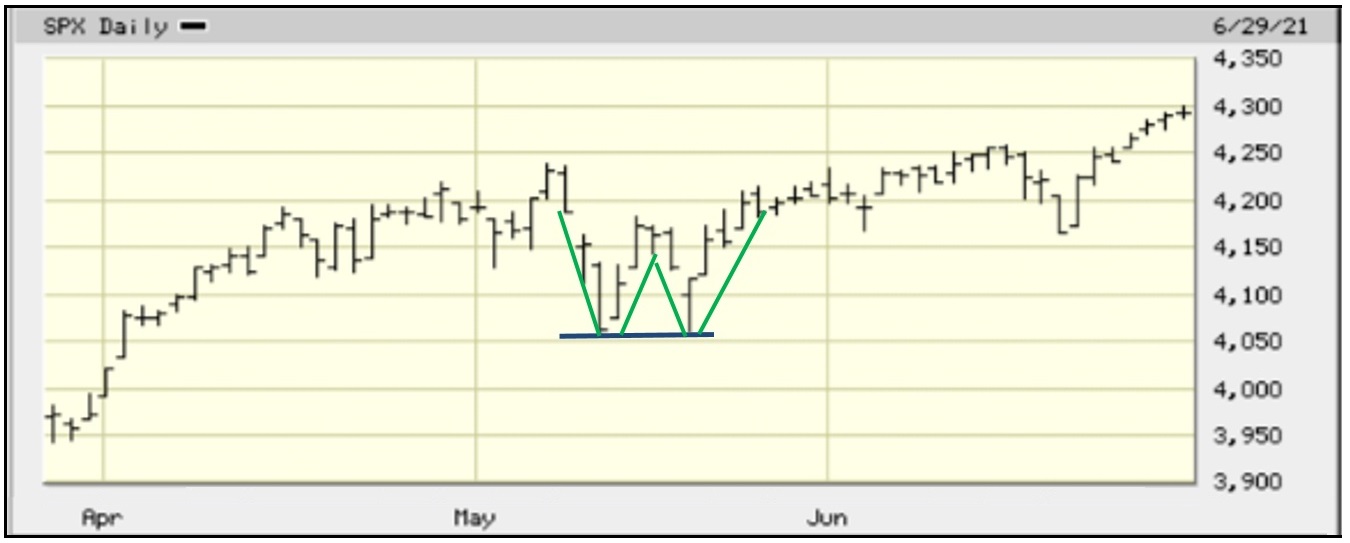
Observations: From a technical point of view, it is not surprising that the S&P 500 Index continues to march to new all-time highs on a regular basis. In the middle of May, the Index traced an almost-perfect W Formation, a continuation pattern (Green lines). In addition, an equally almost-perfect Double Bottom occurred (Dark Blue line). Both patterns, or a pattern within a pattern, are bullish. The last significant pull-back by the S&P 500 was the two-month decline in September-October last year. As shown above, the last four days seem to be forming an arc rather than a straight-up trend-line, so this could be the beginning of a roll-over.
Dow Jones Industrial Average
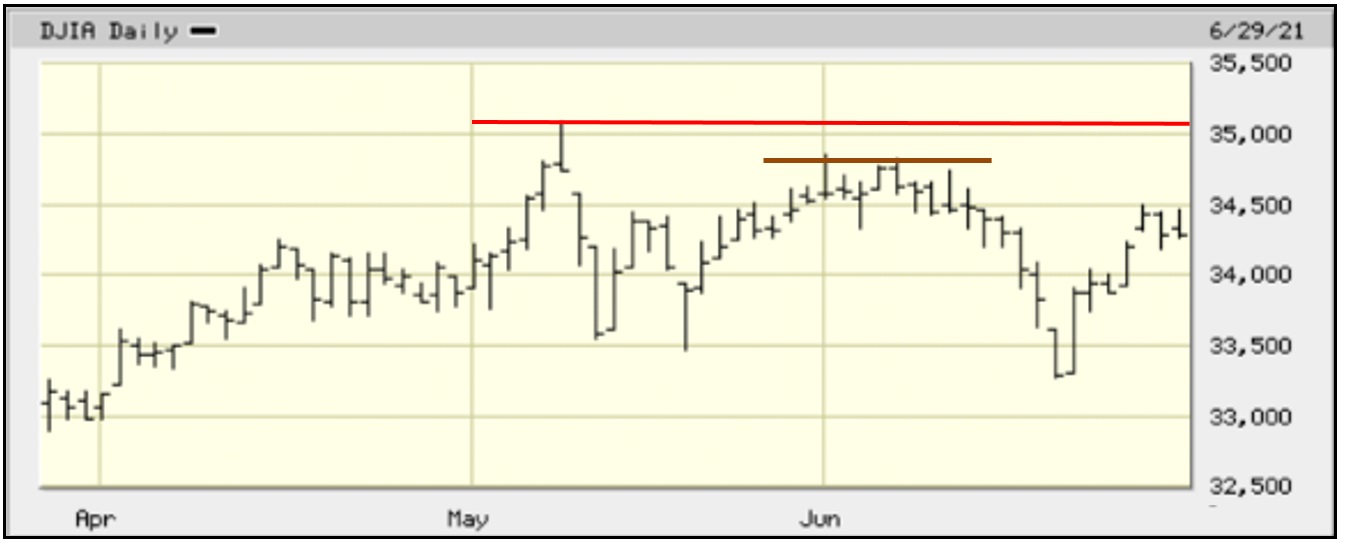
Observations: On a three-month basis, the DJIA chart is completely different from the chart of the S&P 500 Index. The DJIA formed an arc (like I suggested the S&P 500 was now starting to do) from mid-May until mid-June. If the DJIA is not able to surpass the high of the arc (Brown line) as well as the all-time high over 35,000 (Red line) that occurred in the first week of May, then this would be bearish and a pull-back would be expected. It is not usual that the U.S. indexes move in different directions from each other for any extended time. So, a pull-back in the DJIA, if it occurs before a decline in the S&P 500, would likely negatively affect the other index. BTW, in the chart above, there is a warped W Formation (not depicted) for the DJIA in the middle of May, but it did not act the same as did the S&P 500 Index.
NASDAQ Composite Index
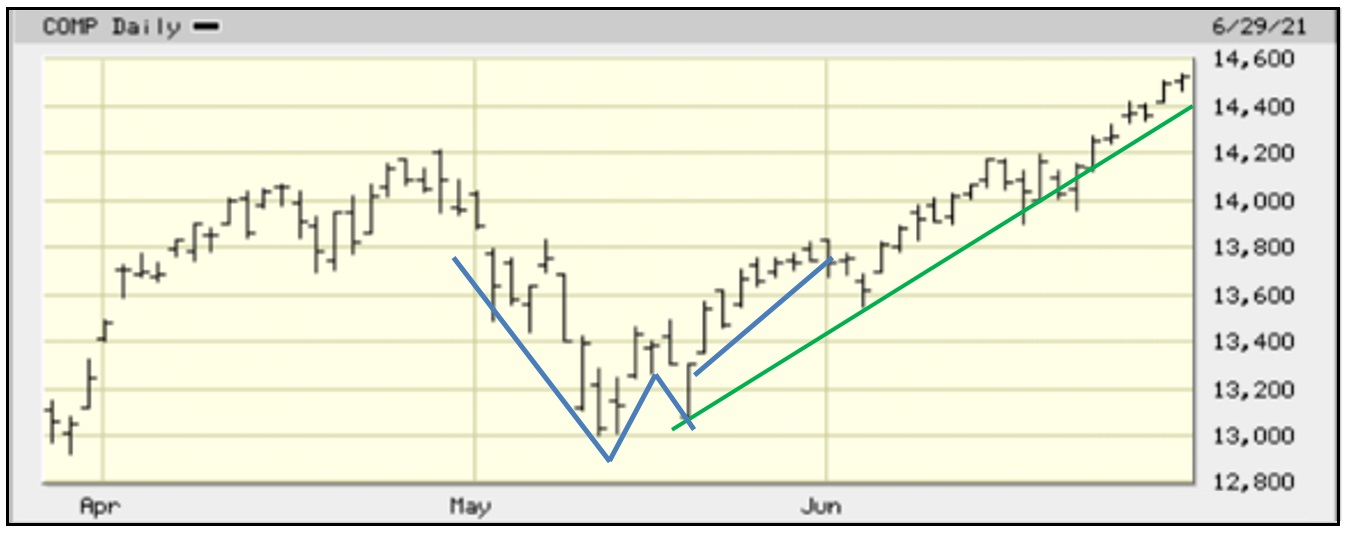
Observations: The NASDAQ sold off more than the other two indexes in May. But it still formed a W Formation (identified by the Blue lines) the top of which is at 13,800. The expected upward (continuation) move is equal to the difference between the top of the W and the bottom of the W (which is 13,800-13,000, or 800 points). This suggests the upward move from 13,800 would reach 14,600. It is almost there! The question now becomes … Will the NASDAQ top out at 14,600? Or will it move higher or go into a tail-spin? In the meantime, the up-trend line (Green line) is still intact and shows no propensity to breaking down at the moment.
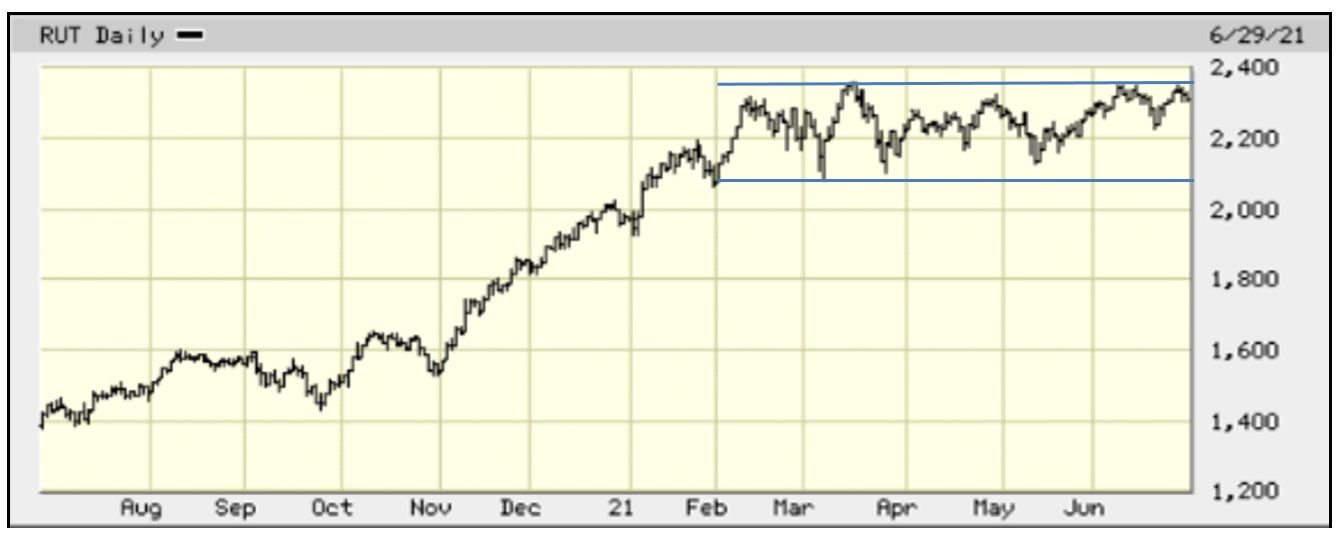
Russell 2000 Index

Observations: The Russell 2000 reflects the activity of small-cap stocks, which usually run independently of their large-cap cousins. The three-month chart above is not very informative, other than the Red line represents resistance, which the Index must break through if it is to continue its rising trend. Despite this short-term problem, if you looked at a longer-tem chart, you would see that RUT (the symbol for the Russell 2000) has moved in a fairly narrow band since mid-February. This Rectangle formation must result in either an upside break-out or a downside break-down. The six-month chart, shown below, is inconclusive in this respect. However, the Index is bumping along the upper trend-line of the Rectangle and is more likely to break out on the upside than break down and drop below 2,070, which is the lower trend-line of the Rectangle.
S&P/TSX Composite Index

Observations: Right now, the TSX Index is toying with the up-trend (Green) line. It has just broken below it, but not with any price conviction. In many ways, the TSX Index is acting independently of its U.S. counterparts. This is not unusual given the heavy preponderance of resource stocks in the Canadian index environment, and also the large component of financial stocks, particularly the chartered banks. At the moment, the TSX Index is subject to a narrow Double Top, and the Index has to break out above this (Red) resistance line before any meaningful advance can occur.
COMMENT: We have been saying for some time that we are expecting a summer pull-back. If a consolidation or pull-back does occur over the summer months, then investors should review which indexes and sectors of the market are best placed to out-perform the others. Here is where our monthly Seasonality Trends reports would be very useful.
Changes for July
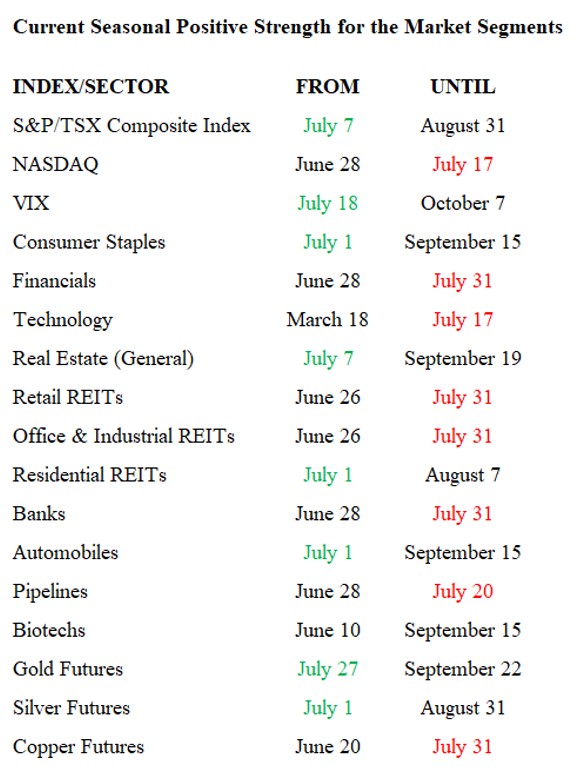
For July, there are eight market sectors that exhibit new seasonal strength These include the S&P/TSX Composite Index, the VIX, Consumer Staples, Real Estate (General), Residential REITs, Automobiles, Gold Futures, and Silver Futures.
The eight sectors that leave their period of seasonality strength behind are: the NASDAQ Composite Index; Financials; Technology; Retail REITs; Office & Industrial REITs; Banks; Pipelines; and Copper Futures.
Seasonal Trends for the Market Segments in July
The following table shows which indexes/sectors gain or lose seasonal strength during the month of July. There are 8 additions this month, shown in GREEN under FROM, and 8 expiries this month, shown in RED under UNTIL.
NOTE: A full seasonality list of indexes and sectors is provided at the end of this report.
Importance of Seasonality Trends
Seasonality refers to particular time-frames when stocks/sectors/indexes are subjected to and influenced by recurring tendencies that produce patterns that are apparent in the investment valuation process. A seasonality study preferably uses at least 10 years of data.
Seasonality Trends Chart
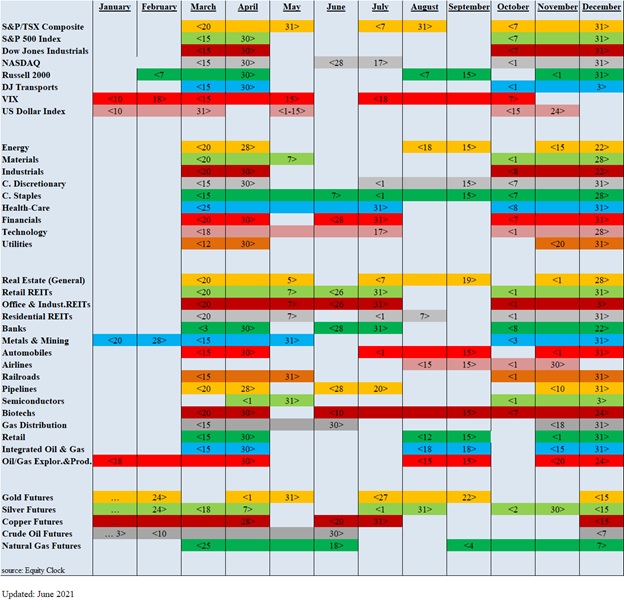
The Seasonality Trends chart below was updated in June 2021. The chart shows the periods of seasonal strength for 38 (formerly 28) market segments (sectors/indexes). Each bar indicates a buy and a sell date based upon the optimal holding period for each market sector/index.
The ten new industry sectors are (1) Retail REITs, (2) Office & Industrial REITs, (3) Residential REITs, (4) Pipelines, (5) Semiconductors, (6) Integrated Oil & Gas, (7) Crude Oil Futures, (8) Automobiles, (9) Airlines, and (10) Railroads.
The Seasonality trends chart is an ever-changing 14-year average of the indexes and sub-indexes that we track. The information in the chart is courtesy of www.equityclock.com.
Notes: All numbers in USD unless otherwise stated. The author of this report, and employees, consultants, and family of eResearch may own stock positions in companies mentioned in this article and may have been paid by a company mentioned in the article or research report. eResearch offers no representations or warranties that any of the information contained in this article is accurate or complete. Articles on eresearch.com are provided for general informational purposes only and do not constitute financial, investment, tax, legal, or accounting advice nor does it constitute an offer or solicitation to buy or sell any securities referred to. Individual circumstances and current events are critical to sound investment planning; anyone wishing to act on this information should consult with a financial advisor. The article may contain “forward-looking statements” within the meaning of applicable securities legislation. Forward-looking statements are based on the opinions and assumptions of the Company’s management as of the date made. They are inherently susceptible to uncertainty and other factors that could cause actual events/results to differ materially from these forward-looking statements. Additional risks and uncertainties, including those that the Company does not know about now or that it currently deems immaterial, may also adversely affect the Company’s business or any investment therein. Any projections given are principally intended for use as objectives and are not intended, and should not be taken, as assurances that the projected results will be obtained by the Company. The assumptions used may not prove to be accurate and a potential decline in the Company’s financial condition or results of operations may negatively impact the value of its securities. Please read eResearch’s full disclaimer.
