eResearch | October was a see-saw month for market performance. Up the first half of the month and down the second half.
This year’s performance was undoubtedly influenced by the political volatility surrounding the U.S. election of November 3. The actual outcome is still not resolved as I write this, but Joe Biden seems destined to become the next American president.
The on-going uncertainty caused by this important political event is likely to impact market decision-making for some time to come. It will also take time for the in-coming Administration to declare its intentions. What will be its initial priorities?
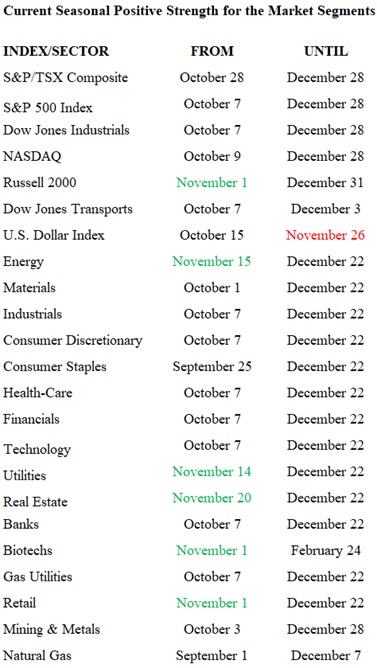
Seasonal Trends for the Market Segments in November
The following table shows which indexes and sectors are “in season” during the month of November. There are six additions this month, shown in GREEN under FROM, and one expiry this month, shown in RED under UNTIL.
NOTE: A full seasonality list of indexes and sectors is provided at the end of this report.
The market index and market sectors added to the seasonality mix in November are Russell 2000, Energy, Utilities, Real Estate, Biotechs, and Retail. The only sector which ends its seasonal strength in November is the U.S. Dollar Index.
Importance of Seasonality Trends
Utilizing the market’s historical seasonality trends can provide a useful framework for assessing and then altering the mix of one’s stock portfolio. Highly volatile markets often open up exceptional opportunities for astute investors to take advantage of market weakness to buy quality stocks that have declined in price significantly in line with the overall market downdraft. As a result, market sectors that are “in season” often provide exceptional stock-buying opportunities in such dire market conditions.
Seasonality refers to particular time-frames when stocks/sectors/indexes are subjected to and influenced by recurring tendencies that produce patterns that are apparent in the investment valuation process. A seasonality study preferably uses at least 10 years of data. Our data (courtesy of Equity Clock) is for 14 years.
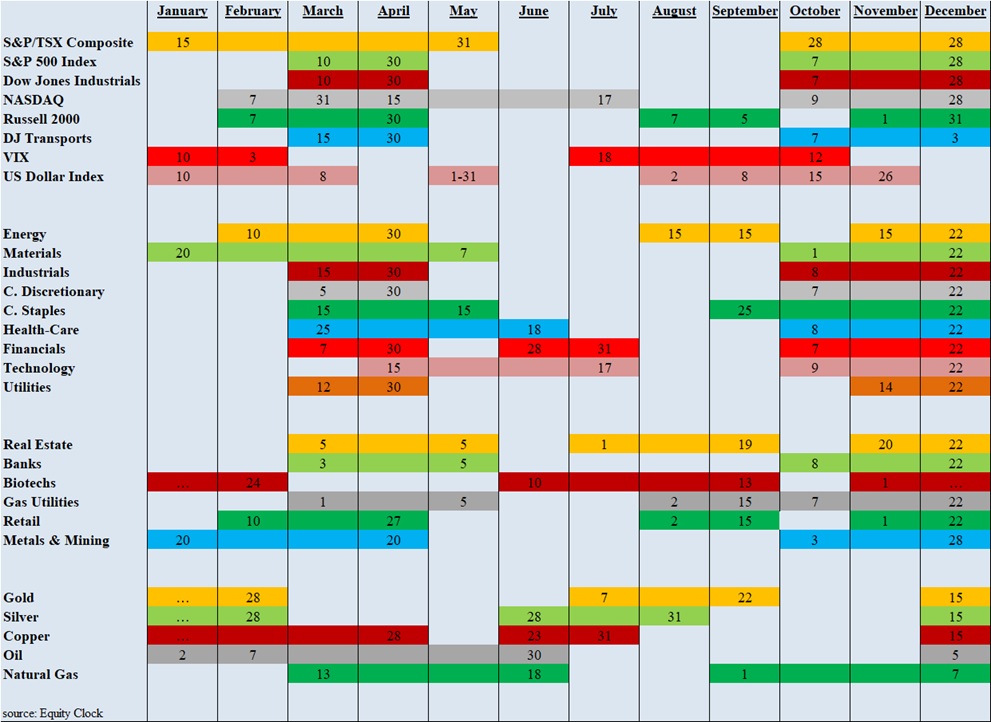
Seasonality Trends Chart
The Seasonality trends chart is an ever-changing 14-year average of the indexes and sub-indexes that we track. The charts are courtesy of www.equityclock.com.
The Seasonality Trends chart below has been updated as of May 2020. It shows the periods of seasonal strength for 28 market segments (sectors/indexes). Each bar indicates a buy and a sell date based upon the optimal holding period for each market sector/index.