eResearch | Is the anticipated market pull-back now at hand? Well, a number of economic indicators are pointing that way.
For instance, the rate of growth in U.S. GDP is slowing. The U.S. Purchasing Managers Index (PMI) peaked in March, although it is currently around 60 and still well in positive territory (>50). The New York Empire Manufacturing Index peaked in May. The Delta variant case-load continues to rise at an alarming rate in the USA, and this will have an increasingly negative effect on the country’s economic recovery. Other world economies are in a similar state.
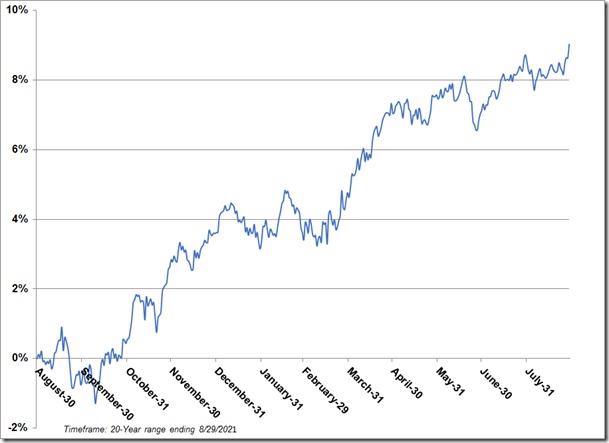
FIGURE 1: S&P 500 Index Seasonality
Changes for September
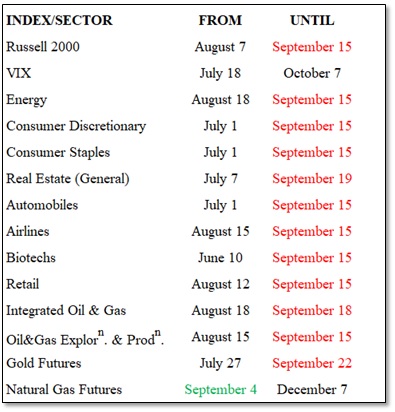
The ONE market index/sector that exhibits new seasonal strength in September is Natural Gas Futures.
The TWELVE index/sectors that leave their period of seasonality strength behind this month are: Russell 2000, Energy, Consumer Discretionary, Consumer Staples, Real Estate (General), Automobiles, Airlines, Biotechs, Retail, Integrated Oil & Gas, Oil&Gas Exploration & Production, and Gold Futures.
The THREE index/sectors that left at the end of August are: the S&P/TSX Composite Index, Residential REITs, and Silver Futures.
Seasonal Trends for the Market Segments in September
The following table shows which indexes/sectors gain or lose seasonal strength during the month of September. There is only 1 addition this month (Natural Gas Futures), shown in GREEN under FROM, but there are 12 expiries this month, shown in RED under UNTIL
NOTE: A full seasonality list of indexes and sectors is provided at the end of this report.
FIGURE 2: Current Seasonal Positive Strength for the Market Segments
Importance of Seasonality Trends
Seasonality refers to particular time-frames when stocks/sectors/indexes are subjected to and influenced by recurring tendencies that produce patterns that are apparent in the investment valuation process. A seasonality study preferably uses at least 10 years of data.
Seasonality Trends Chart
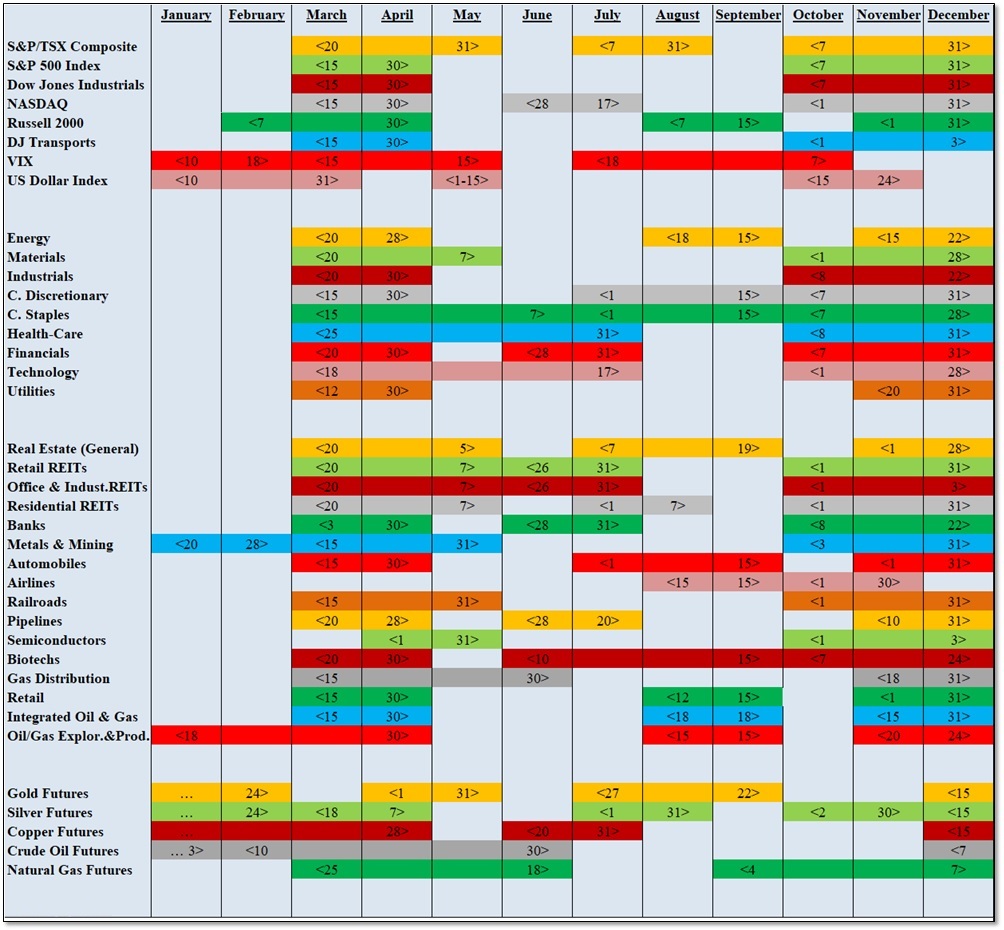
The Seasonality Trends chart below was updated in June 2021. The chart shows the periods of seasonal strength for 38 (formerly 28) market segments (sectors/indexes). Each bar indicates a buy and a sell date based upon the optimal holding period for each market sector/index.
The ten new industry sectors are (1) Retail REITs, (2) Office & Industrial REITs, (3) Residential REITs, (4) Pipelines, (5) Semiconductors, (6) Integrated Oil & Gas, (7) Crude Oil Futures, (8) Automobiles, (9) Airlines, and (10) Railroads.
The Seasonality trends chart is an ever-changing 14-year average of the indexes and sub-indexes that we track. The information in the chart is courtesy of www.equityclock.com.
FIGURE 3: Seasonality Trends Chart (Updated June 2021)
Notes: All numbers in USD unless otherwise stated. The author of this report, and employees, consultants, and family of eResearch may own stock positions in companies mentioned in this article and may have been paid by a company mentioned in the article or research report. eResearch offers no representations or warranties that any of the information contained in this article is accurate or complete. Articles on eresearch.com are provided for general informational purposes only and do not constitute financial, investment, tax, legal, or accounting advice nor does it constitute an offer or solicitation to buy or sell any securities referred to. Individual circumstances and current events are critical to sound investment planning; anyone wishing to act on this information should consult with a financial advisor. The article may contain “forward-looking statements” within the meaning of applicable securities legislation. Forward-looking statements are based on the opinions and assumptions of the Company’s management as of the date made. They are inherently susceptible to uncertainty and other factors that could cause actual events/results to differ materially from these forward-looking statements. Additional risks and uncertainties, including those that the Company does not know about now or that it currently deems immaterial, may also adversely affect the Company’s business or any investment therein. Any projections given are principally intended for use as objectives and are not intended, and should not be taken, as assurances that the projected results will be obtained by the Company. The assumptions used may not prove to be accurate and a potential decline in the Company’s financial condition or results of operations may negatively impact the value of its securities. Please read eResearch’s full disclaimer.