eResearch | We continue to monitor four indicators to help guide us through the stock market volatility:
- CBOE Volatility Index (VIX)
- S&P 500 Chart of the 2008-2009 Recession with today’s S&P 500 mapped over it.
- S. Coronavirus New Cases
- S. Seasonally Adjusted Weekly Unemployment Claims
During the week, the CBOE Volatility Index (VIX) remained in the “High Volatility” range and the S&P 500 index was up 5% as Unemployment Claims reached almost 42 million and daily new Coronavirus remained steady around 20,000.
The positive news of the week was the U.S. Bureau of Labor Statistics reporting that the U.S. unemployment rate declined to 13.3% in May instead of rising as it was expected to do.
1) VIX: S&P 500 Market Volatility Index
| This week: 24.5 | Last week: 30.5 | 2 weeks ago: 28.2 | 3 weeks ago: 31.9 |
| Remains in the “High Volatility” range. | |||
| Why it is important: The VIX index measures the market’s expectation for the 30-day forward-looking volatility and is derived from the S&P 500 index options. | |||
| Below 12: Low volatility | 12 to 20: Normal volatility | Above 20: High volatility | |
CHART 1: VIX Index Chart – Year-to-Date – Drop Below 30 Again, Currently at 24.5, Down from 30.5 Last Week
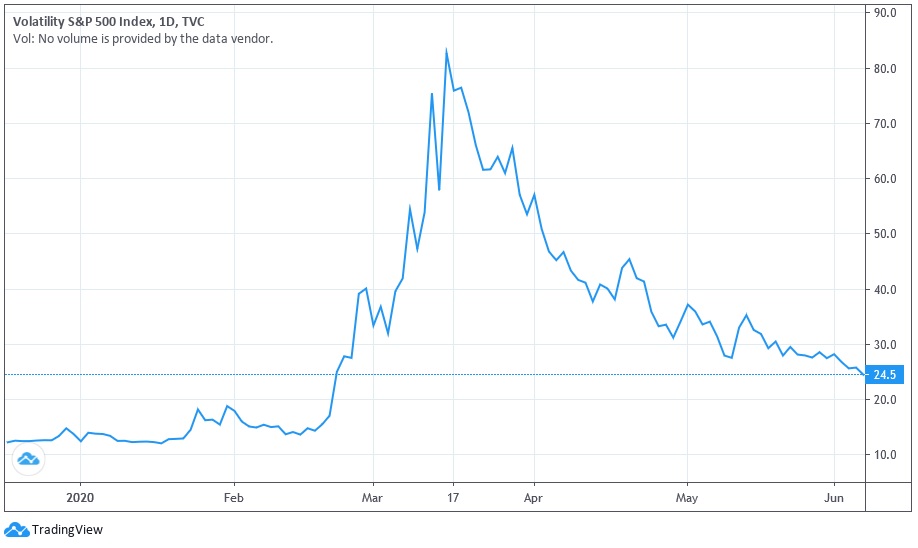
The VIX closed the week below 30 as the equity market seems to be looking further ahead than the current health crisis. However, the VIX is still in the “High Volatility” range.
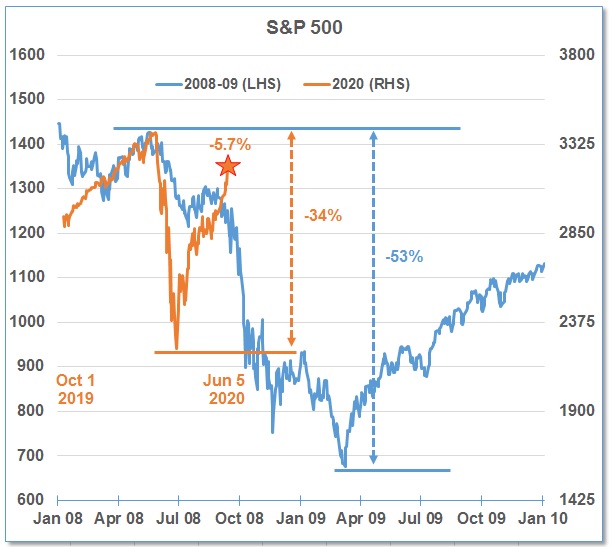
2) S&P 500 Chart
The S&P 500 was up almost 5% last week. The S&P 500 has recorded gains of over 35% in the past 10 months and is now down less than 1% from the start of the year.
In the chart below, we have overlaid the stock market since October 2019 on top of the stock market during 2008-09 during the financial crisis.
- The S&P 500 was up over 5% last week and closed at 3194, down almost 6% from the high of 3386 on February 19 but down less than 1% for the year.
- At the recent bottom, the S&P 500 was down almost 34% from its peak in February.
- During the 2008-09 Financial Crisis recession, the S&P 500 dropped 53%.
- There are many market pundits still believing the S&P 500 will test the previous lows in March but the current “V” recovery is backing the trend from 2008-2009.
CHART 2: Current S&P 500 Index Mapped Over the Chart of the S&P 500 from 2008-2009
3) U.S. Coronavirus New Cases
The U.S. passed 2 million cases this week and added another 6,000 deaths to reach over 112,000 deaths.
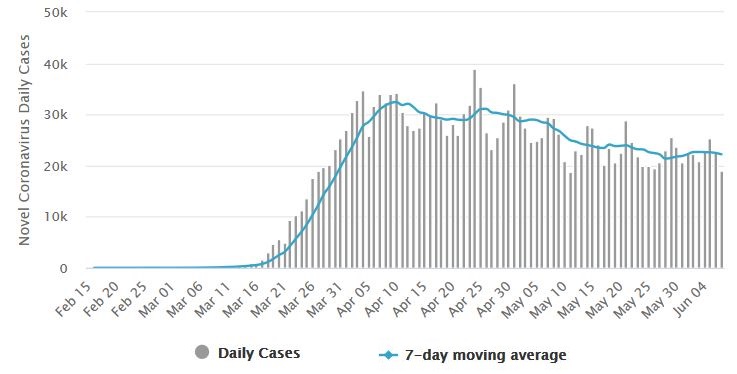
In the U.S., the number of daily new cases remained firm this week at around 20,000, however the 7-day moving average continues to trend downward. The peak remains on April 24 with 39,000 new cases.
Although the U.S. continues to be the country with the highest number of coronavirus-related deaths, the data continues to show the U.S. death rate is growing at a decreasing rate, perhaps illustrating that social distancing is reducing the spread.
CHART 3: Daily New Cases of COVID-19 in the United States
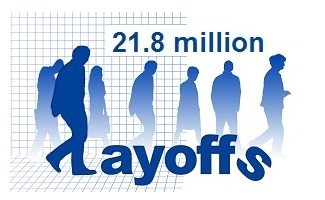
4) U.S. Seasonally Adjusted Weekly Unemployment Claims
Last week, 1.88 million Americans applied for unemployment benefits. This amount is slightly lower than 2.1 million, from the previous week. Unemployment claims peaked at over 6.8 million during the March 29 – April 4 period. The recent ten-week total is now over 41.9 million.
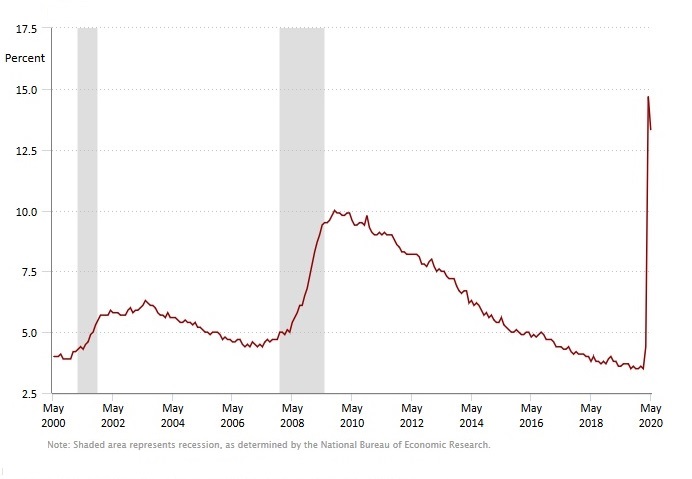
On Thursday, the U.S. Bureau of Labor Statistics reported the U.S. unemployment rate declined to 13.3% in May instead of rising as it was expected to do. According to the report, the U.S. economy added 2.5 million jobs, mostly in the hard-hit Leisure and Hospitality industries.
However, this result is in conflict with the report ADP published on June 3 that stated private payrolls fell by 2.76 million in May.
The May 8 unemployment rate was 14.7%, the highest rate since the Great Depression. Analysts at Goldman Sachs had estimated that the U.S. unemployment rate could rise to above 25%.
CHART 4: U.S. Weekly Unemployment Claims
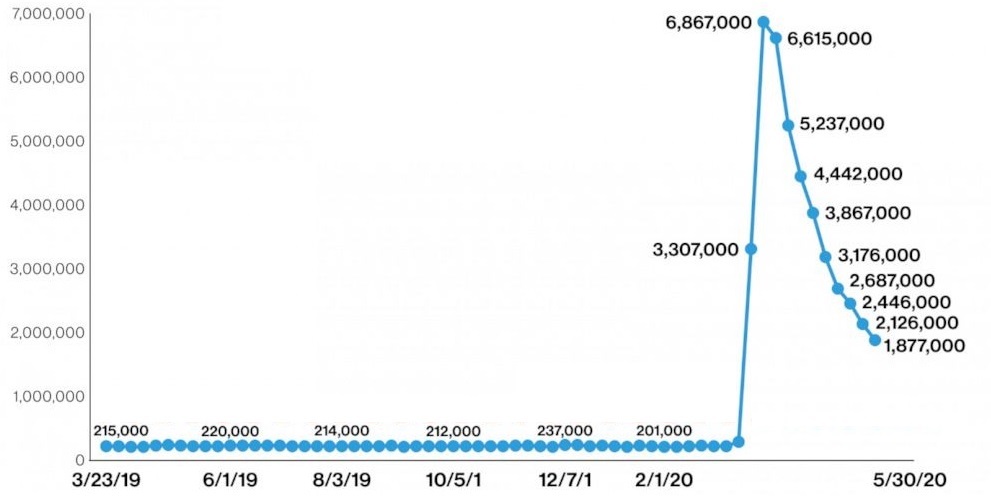
CHART 5: U.S. Unemployment Rate, Seasonally Adjusted
//