eResearch | This past week, the tech conglomerates that dominate the online industries reported calendar Q1/2020 earnings, including companies Alphabet Inc. (NASDAQ: GOOGL), Amazon.com, Inc. (NASDAQ: AMZN), Apple Inc. (NASDAQ: APPL), Facebook, Inc. (NASDAQ: FB), and Microsoft Corp. (NASDAQ: MSFT).
CHART 1: S&P 500 vs AMZN, AAPL, FB, GOOGL, and MSFT
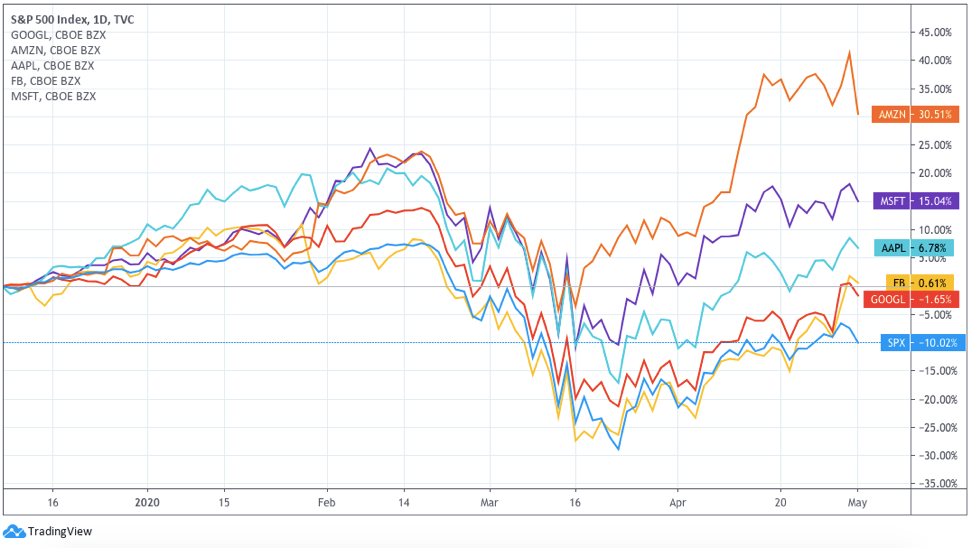
As the COVID-19 pandemic restricts consumers with stay-at-home orders, technology companies have experienced a spike in demand for online businesses such as cloud services and enterprise offerings, but as retail sales plummet, the online advertisement space had significant negative impacts.
See below for further details on the five tech companies and highlights on their calendar Q1/2020 financial reports.
Alphabet
In Q1/2020, Alphabet reported revenues of US$41.2 billion, beating S&P Capital IQ estimates of US$40.2 billion. However, earnings per share were at US$9.87, below expectations of US$10.76.
 Alphabet maintained expected growth through its business segments including Search, YouTube, and Cloud. However, in March, it experienced a slowdown in Advertisement revenue due to retail sales being affected by the COVID-19 pandemic.
Alphabet’s “Other Bets” revenues, which consists of several starts-ups focused on innovative technologies such as autonomous driving and delivery drones, saw its revenue drop by 21% to US$135 million with operating losses increases by 30% to US$1.1 billion.
Moving forward, Alphabet expects increased usage of its software services such as its Google Classroom video conferencing platform and its YouTube subscriptions. Advertisement revenue is expected to return to normal once the economy goes back to regular course.
Alphabet Q1/2020 Financial Highlights
- Revenue of US$41.2 billion, a 13% increase year-over-year, which consists of US$33.7 billion from Google and YouTube advertising, US$2.7 billion from Cloud services, US$4.4 billion from YouTube non-advertising revenue and Google product sales, and US$135 million from Other Bets.
- Operating Expenses of US$33.2 billion, an 11.6% increase year-over-year, mainly due to US$6.8 billion from Research and Development, a 19% increase year-over-year, and US$2.4 billion from Other Cost of Revenues, which include YouTube content acquisition and data center expenses.
- Capital Expenses of US$5.7 billion, a 25% increase year-over-year, mainly used toward investments in data centers and servers.
- Net income of US$6.8 billion, a 2.7% increase year-over-year, attributed to growing advertisement business and increased efficiency in operations.
- Balance Sheet consists of Cash, Cash Equivalents, and Marketable Securities of US$119.7 billion, Current Liabilities of US$45.2 billion, and Long-term debt of US$4.6 billion.
Amazon
In Q1/2020, Amazon reported revenues of US$75.6 billion, beating S&P Capital IQ estimates of US$74.1 billion. However, earnings per share was at US$5.01, below expectations of US$6.24.
![]()
![]() Amazon experienced heightened demand in Q1/2020 as home deliveries increased due to the COVID-19 pandemic, but increased expenses in payroll and shipping has led to higher fulfillment costs and cost of sales, resulting in a greater relative increase in Cost of Sales than Revenue.
Amazon experienced heightened demand in Q1/2020 as home deliveries increased due to the COVID-19 pandemic, but increased expenses in payroll and shipping has led to higher fulfillment costs and cost of sales, resulting in a greater relative increase in Cost of Sales than Revenue.
Additional negative effects of the COVID-19 virus on Amazon include decreased demand for discretionary consumer products, supply chain complications, and increased doubtful accounts from AWS clients.
Amazon is currently prioritizing stocking and delivering of essential products such as household supplies and medical products to support the pandemic. In Q2/2020, Amazon plans to invest its expected US$4 billion in profits on responses to COVID-19.
Amazon Q1/2020 Financial Highlights
- Revenue of US$75.6 billion, a 26% increase year-over-year, attributed to a 24% increase in Online Store sales to US$36.7 billion, a 30% increase in Third-party Seller Services sales to US$14.5 billion, and a 33% increase in AWS sales to US$10.2 billion.
- Operating Expenses of US$71.5 billion, a 29% increase year-over-year, mainly due to a 30% increase in Cost of Sales to US$44.3 billion and a 34% increase in Fulfillment expenses to US$11.5 billion.
- Capital Expenses of US$5.4 billion, a 100% increase year-over-year, used for supporting fulfillment operations and investing in infrastructure for AWS.
- Net Income of US$2.5 billion, a 29% decrease year-over-year, mainly due to a 29% increase in operating expenses.
- Balance Sheet consists of Cash, Cash Equivalents, and Marketable Securities of US$49.3 billion, Current Liabilities of US$79.7 billion, and Long-term Debt of US$63.7 billion (includes Long-term Lease Liabilities).
Apple
In FQ2/2020, Apple reported revenues of US$58.3 billion and earnings per share of US$2.55, beating S&P Capital IQ estimates of US$54.6 billion in revenue and US$2.26 in earnings per share.
![]()
![]() Apple usually experiences a spike in demand during the first quarter of the year due to the holiday season, but in February, the COVID-19 virus disrupted supply chains and logistics services provided by third-party partners.
Apple usually experiences a spike in demand during the first quarter of the year due to the holiday season, but in February, the COVID-19 virus disrupted supply chains and logistics services provided by third-party partners.
As a result, Apple experienced supply shortages for its highest selling product, the iPhone, leading to a US$2 billion decrease in sales compared with the previous year. On the brighter side, as more consumers stay at home, Digital Content Stores and Streaming Services reported a 17% increase in sales to US$13 billion.
In March, Apple temporarily closed all of its retail stores outside of China, with several points of sales partners temporarily ceasing operations. Moving forward, Apple is confident its existing cash balance will be sufficient to satisfy capital and liquidity needs.
Apple FQ2/2020 Financial Highlights
- Revenue of US$58.3 billion, a 0.5% increase year-over-year, attributed to a 17% increase in Digital Content Stores and Streaming Services sales to US$13.3 billion, which was offset by a 6.7% decrease in iPhone sales to US$28.9 billion.
- Cost of Sales of US$31.3 billion, a 0.7% decrease year-over-year, mainly due to a 2% decrease in product costs.
- Operating Expenses of US$9.5 billion, a 13% increase year-over-year, attributed to a 16% increase in Research and Development costs to US$4.6 billion and a 11% increase in SG&A costs to US$4.6 billion.
- Net Income of US$11.2 billion, a 2.7% decrease year-over-year, due to reduced product sales and increased Operating Expenses.
- Balance Sheet consists of Cash, Cash Equivalents, and Marketable Securities of US$40.1 billion, Current Liabilities of US$96 billion, and Long-term Debt of US$145.9 billion.
In Q1/2020, Facebook reported revenues of US$17.7 billion and earnings per share of US$1.71, beating S&P Capital IQ estimates of US$17.2 billion in revenue and in-line with US$1.70 in earnings per share.
![]()
![]()
In March, Facebook had 1.7 billion daily active users, an 11% increase year-over-year as consumers stayed at home due to the COVID-19 virus, but due to economic lockdowns, demand and prices for advertisement sales has significantly decreased.
As a result, Facebook expects a decline in growth rates for advertisement revenues next quarter, with user-engagement expected to retract back to levels before lockdowns spiked online activities.
Facebook intends to continue investing in data centre capacity, network infrastructure, and office facilities, which will drive higher growth in expenses this year.
Facebook Q1/2020 Financial Highlights
- Revenue of US$17.7 billion, a 17.6% increase year-over-year, attributed to a 17% increase in Advertising revenue to US$17.4 billion.
- Cost of Revenue of US$3.5 billion, a 23% increase year-over-year, primarily due to depreciation expenses from infrastructure investments.
- Operating Expenses of US$8.4 billion, a 6.3% decrease year-over-year, mainly due to a 61% decrease in SG&A costs, offset by Research and Development costs increasing by 40.4% to US$4 billion and Marketing costs increasing by 38% to US$2.8 billion.
- Capital Expenses of US$3.7 billion (includes principal payments on finance leases), mainly for investments in data centers, servers, office buildings, and network infrastructure.
- Net Income of US$4.9 billion, a 102% increase year-over-year, mainly due to increases in Advertisement sales and decreases in SG&A costs.
- Balance Sheet consists of Cash and Cash Equivalents, and Marketable Securities of US$60.3 billion, Current Liabilities of US$15.1 billion, and Long-term Debt of US$17.9 billion (includes non-current lease liabilities).
Microsoft
In FQ3/2020, Microsoft reported revenues of US$35 billion and earnings per share of US$1.41, beating S&P Capital IQ estimates of US$33.7 billion in revenue and US$1.27 in earnings per share.
![]()
![]()
Microsoft experienced minimal net impacts on revenues from the COVID-19 pandemic, with high double-digit growth in Productivity and Business Processes and Intelligent Cloud segments. On the other hand, Microsoft saw slowdowns in transactional licensing with SME businesses and reduced advertisement spend on its LinkedIn platform.
As more consumers are situated at home due to stay-at-home restrictions, cloud usage has increased drastically for the Microsoft 365 platform, which includes its video-conferencing platform Teams and its enterprise cloud offering Azure.
In addition, Microsoft’s gaming department, which include its Xbox console and platform, has experienced an increase in activity due to the lockdowns.
Microsoft FQ3/2020 Financial Highlights
- Revenue of US$35 billion, a 15% increase year-over-year, attributed to a 15% increase in Productivity and Business Processes to US$11.7 billion, a 27% increase in Intelligent Cloud to US$12.3 billion, and a 3% increase in Personal Computing to US$10.9 billion.
- Cost of Revenue of US$10.9 billion, an 8% increase year-over-year, mainly due to a 13% increase in Services costs stemming from growth in the commercial cloud segment.
- Operating Expenses of US$11.1 billion, a 10% increase year-over-year, due to a 13% increase in Research and Development costs to US$4.9 billion, a 7.6% increase in Sales and Marketing costs to US$4.9 billion, and an 8% increase in SG&A costs to US$1.3 billion.
- Capital Expenses of US$3.9 billion, a 15% increase year-over-year, for investments in cloud infrastructure and offerings.
- Net Income of US$10.8 billion, a 22% increase year-over-year, mainly due to significant increases in sales from Productivity and Business Processes and Intelligent Cloud segments.
- Balance Sheet consists of Cash and Cash Equivalents, and Short-term Investments of US$137.6 billion, Current Liabilities of US$58.7 billion, and Long-term debt of US$112.2 billion.
//