eResearch Corporation is pleased to provide a summary of CNN Money’s Fear & Greed index for the week ending May 1, 2020.
The current Fear & Greed index is 42 and remains at the “Fear” level for the 4th straight week.
CNN Money creates a Fear & Greed index by looking at seven market indicators: 1) Junk Bond Demand, 2) Put and Call Options, 3) Market Momentum, 4) Market Volatility, 5) Safe Haven Demand, 6) Stock Price Breadth, and 7) Stock Price Strength. (See below for more details on each indicator.)
TABLE 1: Ranking of Each Indicator for the Week Ended May 1
| INDICATOR | RATING |
| Junk Bond Demand | Extreme Fear |
| Put and Call Options | Greed |
| Market Momentum | Extreme Fear |
| Market Volatility | Fear |
| Safe Haven Demand | Extreme Greed |
| Stock Price Breadth | Fear |
| Stock Price Strength | Fear |
| RESULT: 43 | Fear |
DIAGRAM 1: Fear & Greed Index Meter
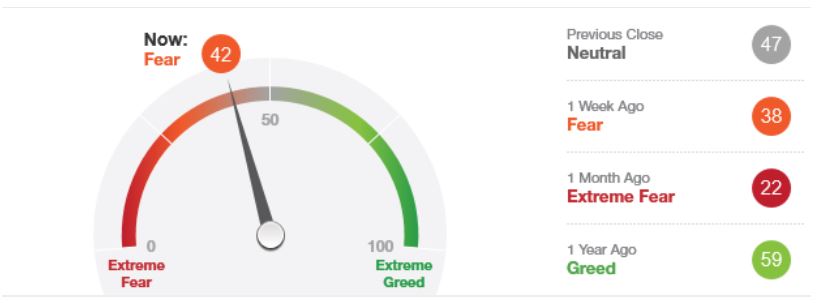
The rationale for the index is that investors are driven by two main emotions: Fear and Greed.
- When too much Fear rules the market – stock prices might drop below their intrinsic value.
- When too much Greed rules the market – stock prices might be bid up, above their intrinsic value.
Each market indicator is rated on a scale from 0 to 100, the higher the reading, the greedier investors are being; 50 is neutral. All of the Indicators are summed, equally weighted, for a final index reading.
Key:
Status Reading
Extreme Fear 0-25
Fear 26-44
Neutral 45-55
Greed 56-74
Extreme Greed 75-100
DIAGRAM 2: Fear & Greed Index Three-year Graph
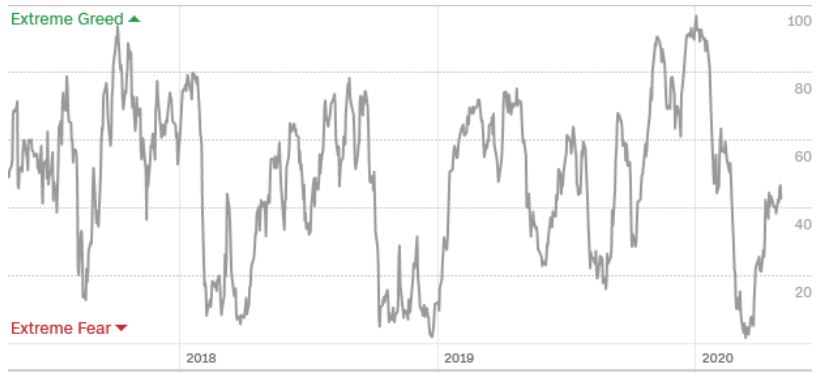
CNN Money Fear & Greed index is calculated from seven market indicators:
- Junk Bond Demand: The spread between yields on investment grade bonds and junk bonds. The higher the spread, the more risk adverse investors are.
- Put and Call Options: The put/call ratio, which compares the trading volume of bullish call options relative to the trading volume of bearish put options.
- Market Momentum: The S&P 500 (SPX) versus its 125-day moving average
- Market Volatility: The CBOE Volatility Index (VIX) measures volatility over the next 30 days.
- Safe Haven Demand: The difference in 20-day stock and Treasury returns.
- Stock Price Breadth: The volume of shares trading in stocks on the rise versus those declining using the McClellan Volume Summation Index.
- Stock Price Strength: The number of stocks hitting 52-week highs and lows on the New York Stock Exchange.
LINK TO THE ORIGINAL ARTICLE
You can visit CNN Money’s Fear & Greed index by clicking here: money.cnn.com/data/fear-and-greed/
NOTE: The above link is “live” and the readings will change during each trading day. The readings are “static” from about 5:00 pm until the next market opening day.
//