We continue to monitor four indicators to help guide us through the stock market volatility:
- CBOE Volatility Index (VIX)
- S&P 500 Chart of the 2008-2009 Recession with today’s S&P 500 mapped over it.
- U.S. Coronavirus New Cases
- U.S. Seasonally Adjusted Weekly Unemployment Claims
The CBOE Volatility Index (VIX) remains in the “High Volatility” range and the S&P 500 index was down 1.3% as Unemployment Claims reached almost 25 million and new Coronavirus cases hit a new high during last week.
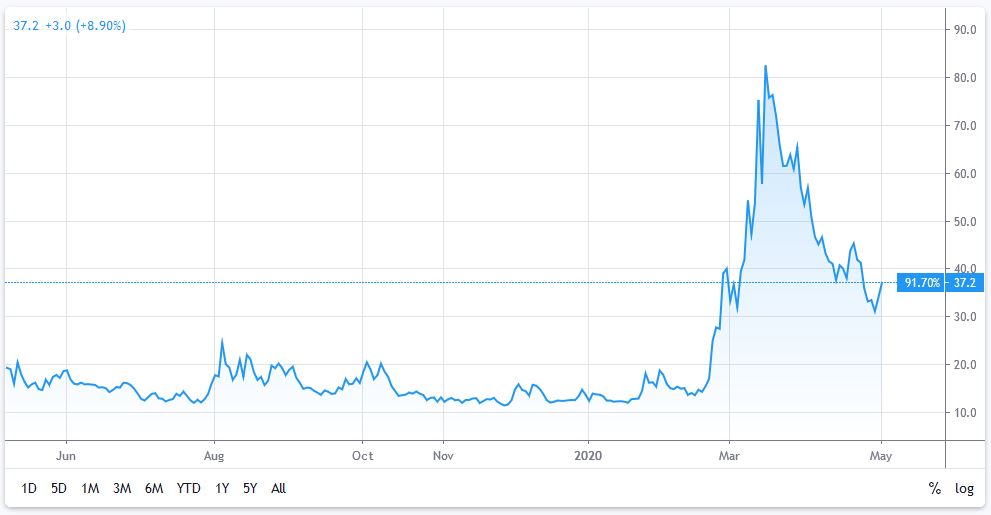
1) VIX: S&P 500 Market Volatility Index
| This week: 37.2 | Last week: 36.3 | 2 weeks ago: 38.2 | 3 weeks ago: 41.7 |
| Remains in the “High Volatility” range. | |||
| Why it is important: The VIX index measures the market’s expectation for the 30-day forward-looking volatility and is derived from the S&P 500 index options. | |||
| Below 12: Low volatility | 12 to 20: Normal volatility | Above 20: High volatility | |
CHART 1: VIX Index Chart – Year-to-Date – Currently at 37.2 Slightly Higher from 36.3 Last Week
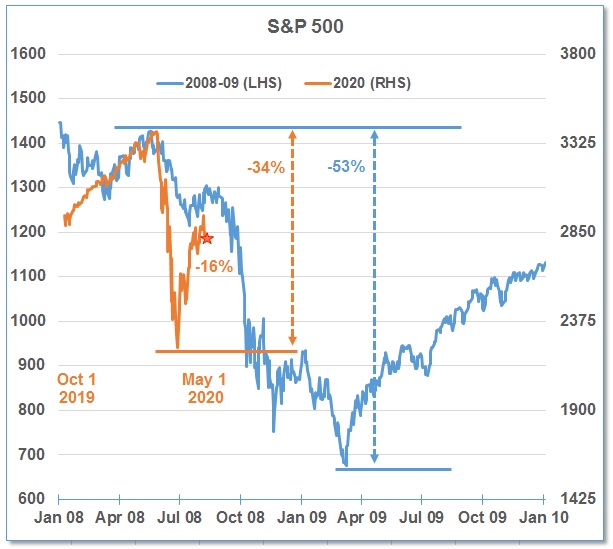
2) S&P 500 Chart
Although the S&P 500 posted its best month in over 30 years, the index was down slightly last week and is still down over 12% for the year.
In the chart below, we have overlaid the stock market since October 2019 on top of the stock market during 2008-09 during the financial crisis.
- The S&P 500 was down 0.2% last week and is at 2831, still down 16% from the high of 3386 on February 19.
- At the recent bottom, the S&P 500 was down almost 34% from its peak in February.
- During the 2008-09 Financial Crisis recession, the S&P 500 dropped 53%.
- With “bottom fishers” buying during the first drop and the shorts covering, the current rebound is stalling and there remains a potential for another drop in the North American indices as the full effects of the shutdowns and shut-ins percolate through the economy.
CHART 2: Current S&P 500 Index Mapped Over the Chart of the S&P 500 from 2008-2009
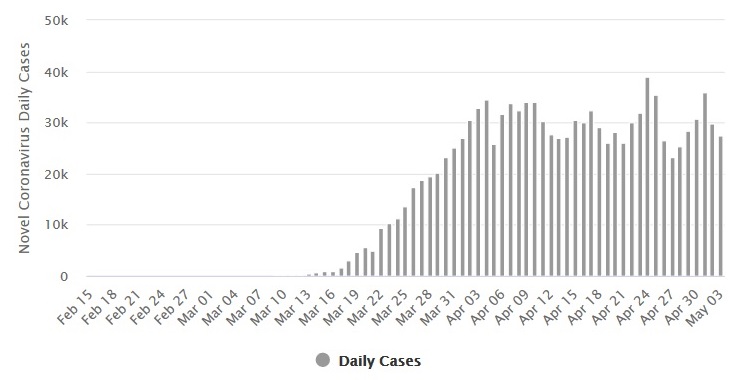
3) U.S. Coronavirus New Cases
The U.S. has the dubious honour of hitting 1 million coronavirus cases this week and ended the week with over 1.1 million cases.
The number of daily new cases continues to oscillate between 23,000 and 36,000. The peak seemed to take place on April 24 with 39,000 new cases. The swing in the number of new cases could be caused by the availability of Covid-19 testing.
The U.S. continues to be the country with the highest number of coronavirus-related deaths, now at over 68,000, still more than double that of Italy. However, the data shows the U.S. death rate is growing at a decreasing rate, perhaps illustrating that social distancing is reducing the spread.
As some states have re-opened parts of their economies, government officials are intently monitoring the impact on new coronavirus cases.
CHART 3: Daily New Cases of COVID-19 in the United States
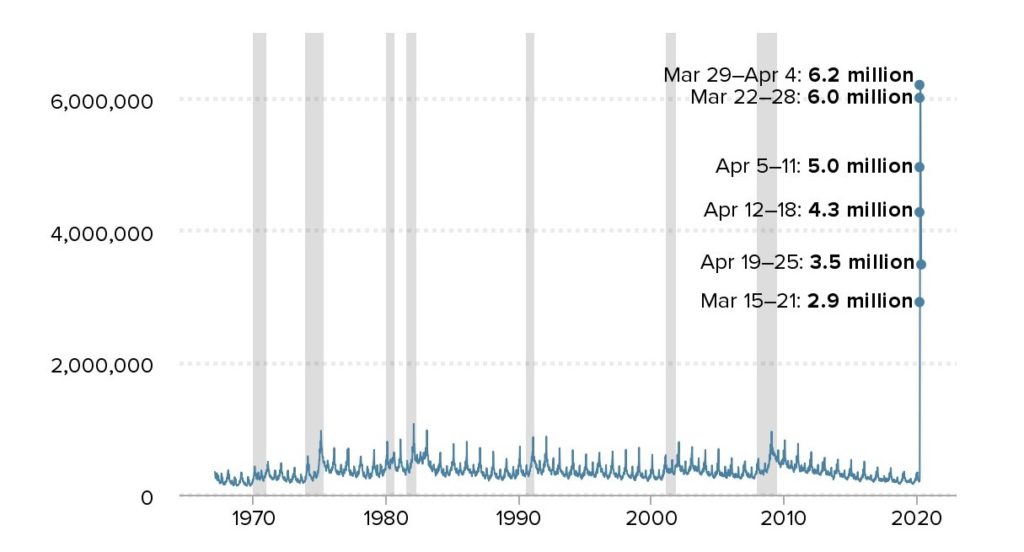
4) U.S. Seasonally Adjusted Weekly Unemployment Claims
Last week, 3,839,000 Americans applied for unemployment benefits as the widespread layoffs caused by the COVID-19 pandemic crisis continued.
This amount is lower than 4.27 million, from the previous week. Unemployment claims peaked at over 6.2 million during the March 29 – April 4 period.
The recent six-week total is now almost 28 million. The continued surge in new unemployment claims was not a surprise as stay-at-home measures now reached 99% of Americans.
As previously noted, some economists expected 15-25 million Americans would likely be laid off or furloughed before the economy recovers from the coronavirus impact and this estimate has now been surpassed.
CHART 4: U.S. Seasonally Adjusted Weekly Unemployment Claims
//