eResearch | The S&P 500 Index is the first of the major U.S. indexes to establish a new all-time high. The Index reached an intra-day value of 3,044.08 and closed the day (October 28) at 3,039.42.
Here is the S&P 500 Index one-year chart.
Chart 1: One-Year Chart
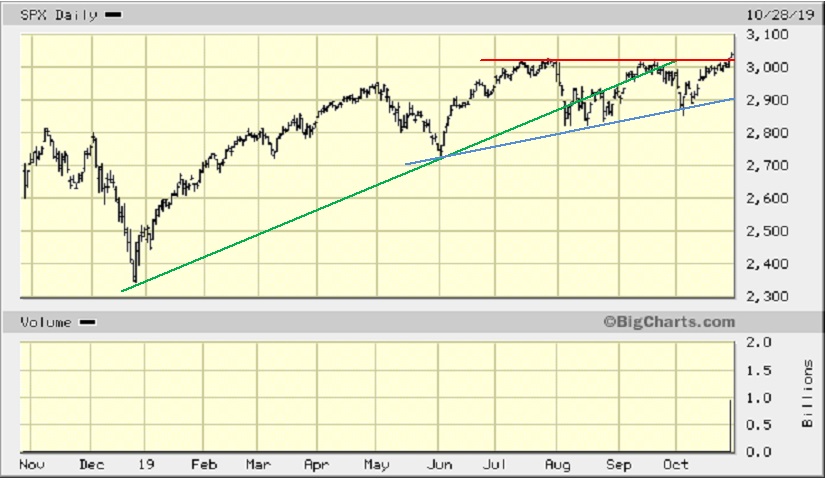
Observations:
2019’s Green up-trend line that started in late December 2018 was breached in August and is no longer a factor. The Blue up-trend line forms the bottom of an ascending triangle, which is bounded on the top by the Red resistance line that has just been broken to the upside.
Chart 2 following takes a look at the Index over the last six months.
Chart 2: Six-Months Chart
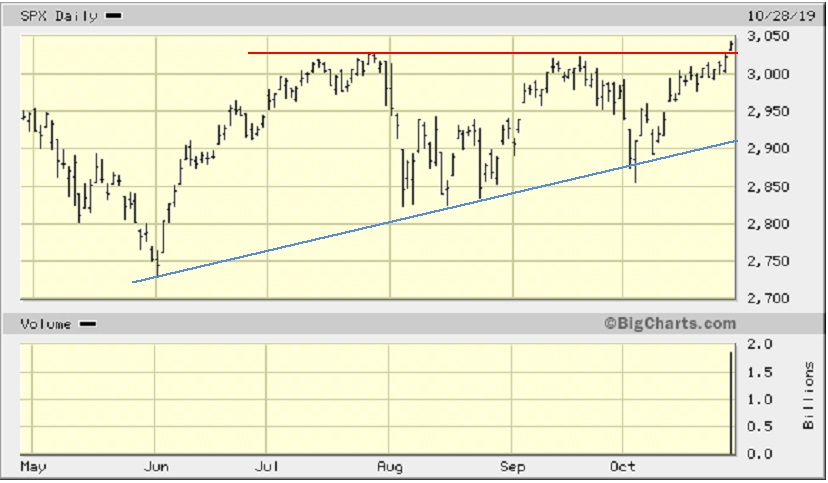
Observations:
Chart 2 above clearly shows the break-out by the Index on Monday above the triangle. If it had failed, it would have completed a very bearish Triple Top. So, the break-out is technically significant. Our rule-of-thumb is that a stock or index has to reach and maintain a 3% premium above the break-out point or previous resistance line. In this case, the Red resistance line is at 3,022 (the high on September 19). 3% above that level is at 3,112.66. So, the Index has to close at or above that level in order to verify the break-out.
Another usual pattern after a break-out is for the stock/index briefly to trend higher and then reverse and come back to test the support line from which it had recently broken above. If the support holds, then the stock or index usually marches higher. If it does not hold, then “look out below”.
CONCLUSION
While breaking into new all-time high territory is obviously a bullish occurrence, nevertheless the S&P 500 Index needs to establish itself above its newly-formed support level at about 3,022. If it can do this, then the second-longest bull market will likely continue. If it cannot, then it portends the possibility of a market break-down. For that to happen, there definitely has to be a significant catalyst, currently unknown as to content and as to date.
//