Ark Invest projects that by 2030, the revenue generated from AI software could reach approximately $14 trillion. This forecast suggests a potential market size surpassing Nvidia‘s present valuation by a factor of 11 times.
In alignment with this outlook, Ark Invest has strategically augmented its portfolio with a focus on AI software companies. Notable inclusions are The Trade Desk, Inc. (NASDAQ: TTD) and UiPath Inc. (NYSE: PATH).
The following article delves into the rationale behind Ark’s investment decisions in these companies. Source
Why Invest in the Trade Desk
![]()
![]() The Trade Desk (TTD) administers a software platform specializing in advertising technology and designed to enhance the efficiency and effectiveness of digital advertising strategies. Its platform equips media buyers with tools for planning, measuring, and optimizing advertising campaigns across various digital channels.
The Trade Desk (TTD) administers a software platform specializing in advertising technology and designed to enhance the efficiency and effectiveness of digital advertising strategies. Its platform equips media buyers with tools for planning, measuring, and optimizing advertising campaigns across various digital channels.
According to Quadrant Knowledge Solutions, while Alphabet‘s Google commands a significantly larger portion of the market, TTD, operating as an independent advertising technology vendor, is recognized for possessing superior technology and more advanced artificial intelligence capabilities.
TTD does not own any media content or sell any ad inventory while Google, by comparison, sells ad inventory from properties like Google Search and YouTube while at the same time helping third-party publishers sell their own inventory. Due to the clear conflict of interest, brands are hesitant to share data with Google, but they do not have reservations regarding TTD.
In the third quarter of this year, TTD continued to gain market share with revenue climbing 25% to $493 million, easily topping the 9% ad revenue growth reported by Alphabet, and GAAP net income almost doubled to hit $39 million.
Morgan Stanley views TTD as one of 11 companies best positioned to benefit from AI and TTD is positioned to potentially outpace the overall growth of the ad tech industry, which is estimated to grow annually at 14% through to 2030.
The Trade Desk has:
- A market capitalization of $32.6B as of November 20, 2023
- A YTD stock price appreciation of 54.0% compared to the industry average of 47.3% (Source)
- A forward price-to-earnings (PE) ratio of 52.4x (Very High – 254% above the *Communication Service/Advertising sector (33 stocks) mean of 14.8x)
- A forward price-to-sales ratio (PSR) of 17.0x (Extremely High – 1,411% above the sector mean of 1.1x)
- A price-to-earnings-growth (PEG) ratio of 2.3x (High – 51% above the sector mean of 1.5x)
- an Enterprise Value-to-Earnings Before Interest Taxes, Depreciation, and Amortization (EV/EBITDA) ratio of 41.2x (Very High – 394% above the sector mean of 8.3x)
According to the above valuation metrics, the stock price is currently extremely high but it probably has merit as a 3-5 year hold according to Morgan Stanley based on its acceptable PEG ratio.
UiPath
 UiPath’s software integrates robotic process automation (RPA) with AI functionalities, offering customers a comprehensive suite for enhancing operational efficiency. This integration enables clients to:
- Conduct thorough analyses of tasks and processes, facilitating the identification of potential automation opportunities.
- Develop software robots tailored to address identified automation needs.
- Effectively manage and optimize the performance of these software robots, ensuring continual improvement and efficiency in automated processes.
Revenue improved 19% in Q2 to $287 million and non-GAAP net income increased from a loss of $11 million to a profit of $49 million.
Investors may anticipate an acceleration in growth for UiPath as economic conditions ameliorate. This expectation is underpinned by UiPath‘s strategic emphasis on its AI-centric development roadmap, of products and features such as:
- Autopilot: a generative AI assistant, which enhances the user experience of its platform by introducing a more conversational interface. This feature enables users to interact with the platform using natural language, facilitating a range of functions such as executing existing automations, creating new automations, and identifying potential automation opportunities;
- Clipboard AI: a feature that intelligently copies and pastes data between applications, documents, and spreadsheets, and;
- The broadening of its integration capabilities by extending support to custom AI models from companies such as Amazon and OpenAI.
UiPath has:
- A market capitalization of $10.4B as of November 20, 2023
- A YTD stock price appreciation of 51.3% compared to the industry average of 27.1% (Source)
- A forward price-to-earnings (PE) ratio of 44.6x (Extremely High – 100% above the Information Technology/Systems Software sector (46 stocks) mean of 22.3x)
- A forward price-to-sales ratio (PSR) of 8.1x (Extremely High – 217% above the sector mean of 2.6x)
- A price-to-earnings-growth (PEG) ratio of 1.1x (High – 40% below the sector mean of 1.8x)
- An EV/EBITDA ratio of 40.4x (Extremely High – 183% above the sector mean of 14.3x)
Industry Forecast
Morgan Stanley thinks that UiPath could potentially achieve an annual revenue growth rate of 21% over the coming decade, contingent upon the successful realization of its AI-driven strategic initiatives, and that makes its current PSR valuation of 8.3 times sales seem quite reasonable in their opinion.
Indeed, Morgan Stanley thinks UiPath is the “clear category leader in robotic process automation, with leading market share in one of the fastest growing software markets.” Like Morgan Stanley’s assessment of The Trade Desk, while the above valuation metrics for UiPath the stock price are currently extremely high, it also probably has merit as a 3-5 year hold according to Morgan Stanley based on its very low PEG ratio.
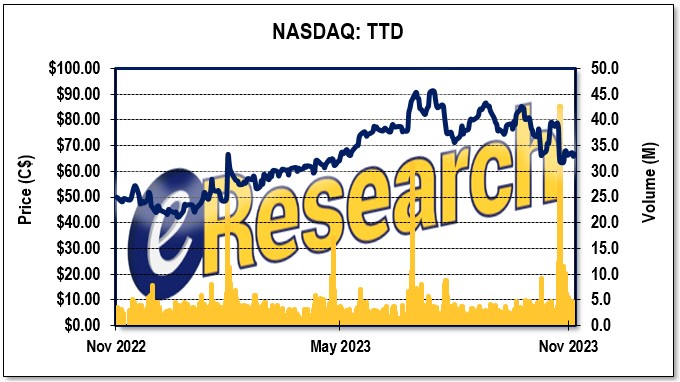
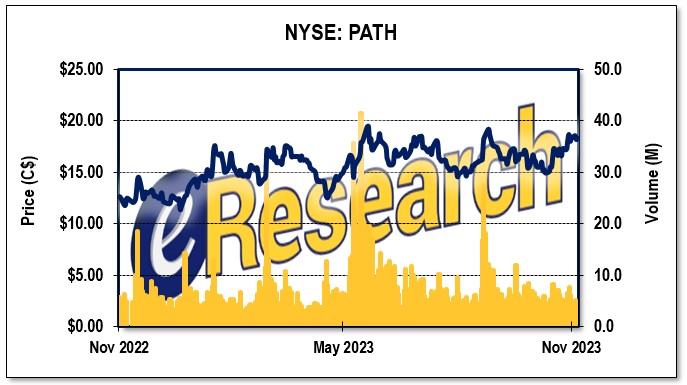
FIGURE 1: 1-Year Stock Charts for TTD and UiPath
Understanding Valuation Metrics
To evaluate the above companies look at the key valuation ratios referred to above and defined below:
- The price-to-earnings (P/E) ratio compares a company’s share price to its earnings per share, providing a measure of relative value. A high P/E ratio could mean that a company’s stock is overvalued, or that investors are expecting high growth rates in the future.
- The price-to-sales ratio (PSR) indicates the price paid for a share relative to the revenue that the share generates, helping assess if a stock is valued appropriately. The mean forward PSR for the EDA Software Sector is 2.5 and is considered excellent when the value falls below two (2).
- The price earnings-to-growth ratio (PEG ratio) is considered to be an indicator of a stock’s true value. A PEG lower than 1.0 is best, suggesting that a company is relatively undervalued.
- The Enterprise Value-to-Earnings Before Interest, Taxes, Depreciation, and Amortization ratio (EV/EBITDA) ratio considers a company’s total value, including debt and equity, relative to its earnings before interest, taxes, depreciation, and amortization, giving investors insight into profitability across companies. A high ratio means the company is overvalued, while a low ratio indicates it’s undervalued.
Notes: All numbers are in USD unless otherwise stated. The author of this report, and employees, consultants, and family of eResearch may own stock positions in companies mentioned in this article and may have been paid by a company mentioned in the article or research report. eResearch offers no representations or warranties that any of the information contained in this article is accurate or complete. Articles on eresearch.com are provided for general informational purposes only and do not constitute financial, investment, tax, legal, or accounting advice nor does it constitute an offer or solicitation to buy or sell any securities referred to. Individual circumstances and current events are critical to sound investment planning; anyone wishing to act on this information should consult with a financial advisor. The article may contain “forward-looking statements” within the meaning of applicable securities legislation. Forward-looking statements are based on the opinions and assumptions of the Company’s management as of the date made. They are inherently susceptible to uncertainty and other factors that could cause actual events/results to differ materially from these forward-looking statements. Additional risks and uncertainties, including those that the Company does not know about now or that it currently deems immaterial, may also adversely affect the Company’s business or any investment therein. Any projections given are principally intended for use as objectives and are not intended, and should not be taken, as assurances that the projected results will be obtained by the Company. The assumptions used may not prove to be accurate and a potential decline in the Company’s financial condition or results of operations may negatively impact the value of its securities. Please read eResearch’s full disclaimer.