An original article by Lorimer Wilson, Managing Editor of munKNEE.com – Your KEY To Making Money!
Nvidia has seen a remarkable 208% increase in its stock value year-to-date, largely due to a significant short-term rise in demand for its versatile AI chips designed for a broad range of applications.
These chips were highly sought after for the development of general AI technologies. However, the trend is now moving towards specialized AI applications, which necessitate the creation of tailored AI chips.
This shift has brought Electronic Design Automation (EDA) software to the forefront. EDA software is a critical component in the design and production of these specialized chips.
Let’s delve into what EDA software is, its projected market growth, and the companies that are likely to benefit from this industry evolution.
What Exactly is EDA Software?
EDA software is a suite of tools used for designing and analyzing electronic systems and integrated circuits. It’s a cornerstone for the development of a wide array of electronic components, from basic microcontrollers to sophisticated custom circuits. Engineers rely on EDA software for several tasks:
- Creating schematics for electronic circuits.
- Simulating circuit functions to identify problems early on.
- Designing printed circuit boards (PCBs) and integrated circuits (ICs).
- Performing analyses on timing, power, and signal integrity.
In short, EDA software acts as a blueprint tool for the semiconductor industry, ensuring that chip designs are functional and meet the required performance criteria. As a result, the EDA software market is on the cusp of a significant expansion, driven by major tech companies like Tesla, Amazon, Microsoft, and Alphabet transitioning from Nvidia’s more generic AI chips to creating their own complex AI chips.
EDA Software Market Growth
The market for EDA software is anticipated to maintain robust growth, with double-digit increases expected to continue throughout the decade. This growth trajectory is likely to be stable, as the demand for EDA software is less susceptible to the fluctuations of economic cycles compared to semiconductor demand. Chip design is a constant need, regardless of economic conditions, making the EDA software market a strategic investment avenue for those looking to capitalize on the AI chip industry’s expansion.
The AI Chip Boom’s First Wave
While Nvidia’s shares have soared, reflecting its dominance in the initial phase of the AI chip industry’s growth, the focus is now shifting towards EDA software companies as the industry evolves. These firms are expected to be at the forefront of the industry’s next phase.
The AI Chip Boom Second Wave
Analysts like Luke Lango have highlighted companies such as Synopsys and Cadence as top contenders in the EDA software space, with market shares of approximately 40% and 30%, respectively. They are considered to be well-positioned to benefit from the burgeoning demand for custom AI chips. Here’s a closer look at these companies:
Synopsys, Inc. (NASDAQ: SNPS): +52.6% YTD
- Synopsys has seen a 52.6% increase in its stock value year-to-date. Despite its high valuation metrics compared to the sector median, the company is making significant strides in the EDA market.
- Market Capitalization: $74.2B;
- Forward PE Ratio: 62.1x (HIGH – 150% above the sector median is 24.8x);
- Forward PSR: 12.7x (EXTREMELY HIGH – 408% above the sector median is 2.5x);
- Forward PEG Ratio: 2.5x (SLIGHTLY HIGH – 39% above sector median is 1.8x);
- EV/EBITDA Ratio: 33.6x (HIGH – 149% above the sector median is 13.5x)
- Read:
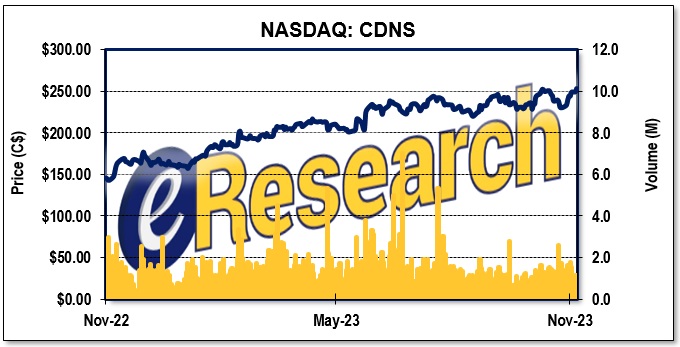
Cadence Design Systems, Inc. (NASDAQ: CDNS) +55.5% YTD
- Cadence also boasts a high valuation, but its performance and market position make it a key player in the EDA software industry.
- Market Capitalization: $67.9B;
- Forward PE Ratio: 71.1x (HIGH – 187% above the sector median is 24.8x);
- Forward PSR: 16.6x (EXTREMELY HIGH – 564% above the sector median is 2.5x);
- Forward PEG Ratio: 2.7x (SLIGHTLY HIGH – 50% above the sector median is 1.8x);
- EV/EBITDA Ratio: 36.9x (HIGH – 173% above the sector median is 13.5x)
- Read:
FIGURE 1: Nvidia’s 1-Year Stock Chart
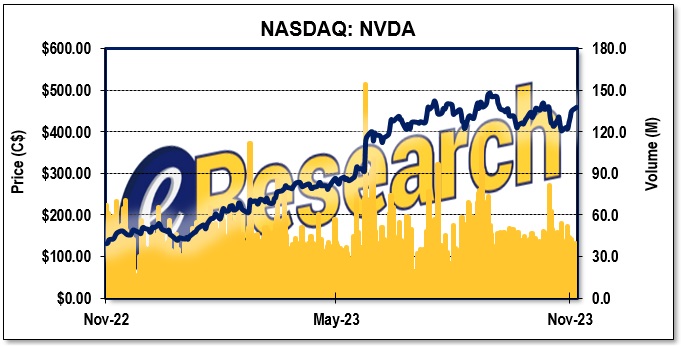
FIGURE 2: Synopsys’ 1-Year Stock Chart
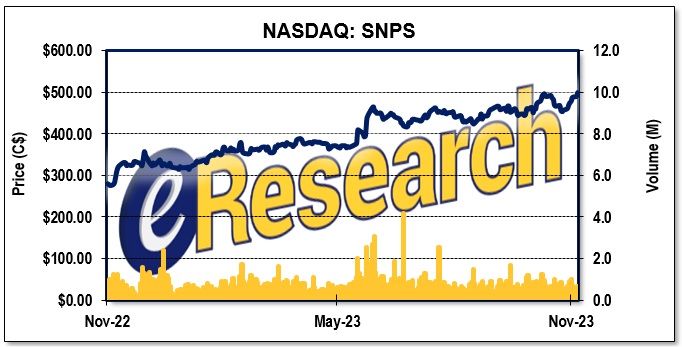
FIGURE 3: Cadence ‘s 1-Year Stock Chart
Understanding Valuation Metrics
To evaluate these companies, investors often look at several key ratios:
- The price-to-earnings ratio (P/E ratio) compares a company’s share price to its earnings per share, providing a measure of relative value. A high P/E ratio could mean that a company’s stock is overvalued, or that investors are expecting high growth rates in the future.
- The price-to-sales ratio (PSR) indicates the price paid for a share relative to the revenue that share generates, helping assess if a stock is valued appropriately. The mean forward PSR for the EDA Software Sector is 2.5 and is considered excellent when the value falls below two (2).
- The price/earnings to growth ratio (PEG ratio) ratio takes into account a stock’s P/E ratio and the company’s expected earnings growth, offering a more nuanced view of value. A PEG lower than 1.0 is best indicating that the stock is undervalued. The mean forward PEG ratio for the EDA Software Sector is 1.8.
- The Enterprise Value-to-Earnings Before Interest, Taxes, Depreciation, and Amortization ratio (EV/EBITDA) ratio considers a company’s total value, including debt and equity, relative to its earnings before interest, taxes, depreciation, and amortization, giving investors insight into profitability across companies. A high means the company is overvalued, while a low ratio indicates it’s undervalued. The mean forward EV/EBITDA ratio for the EDA Software Sector is 13.5.
These metrics are essential for investors to understand the financial health and potential of companies within the EDA software sector.
Notes: All numbers are in USD unless otherwise stated. The author of this report, and employees, consultants, and family of eResearch may own stock positions in companies mentioned in this article and may have been paid by a company mentioned in the article or research report. eResearch offers no representations or warranties that any of the information contained in this article is accurate or complete. Articles on eresearch.com are provided for general informational purposes only and do not constitute financial, investment, tax, legal, or accounting advice nor does it constitute an offer or solicitation to buy or sell any securities referred to. Individual circumstances and current events are critical to sound investment planning; anyone wishing to act on this information should consult with a financial advisor. The article may contain “forward-looking statements” within the meaning of applicable securities legislation. Forward-looking statements are based on the opinions and assumptions of the Company’s management as of the date made. They are inherently susceptible to uncertainty and other factors that could cause actual events/results to differ materially from these forward-looking statements. Additional risks and uncertainties, including those that the Company does not know about now or that it currently deems immaterial, may also adversely affect the Company’s business or any investment therein. Any projections given are principally intended for use as objectives and are not intended, and should not be taken, as assurances that the projected results will be obtained by the Company. The assumptions used may not prove to be accurate and a potential decline in the Company’s financial condition or results of operations may negatively impact the value of its securities. Please read eResearch’s full disclaimer.