eResearch | Has the long-awaited stock market pull-back finally arrived? In the last TWO days (which includes today), the U.S. indexes have encountered stiff resistance to the seemingly never-ending inexorable rise in their closing values. However, all good things must come to an end!
At time of writing, in the last two trading days, the DJIA is down 4.6%, the S&P 500 is off 5.3%, the NASDAQ is lower by 7.3%, and the S&P/TSX Composite has declined by 3.5%.
If this is, indeed, the anticipated sell-off, just how big will it be? And how long will it endure? We are still in the “worst” months for investing, historically, and September has often been cruel. Perhaps this sharp wake-up call should be heeded as the markets have defied a certain logic and have been propelled higher by, maybe, unrealistic expectations. This is now an excellent time to analyze thoroughly your portfolio and make appropriate adjustments.
Within that context, we suggest that historic seasonality trends could be highly useful in the restructuring of investment portfolios.
Seasonal Trends for the Market Segments in September
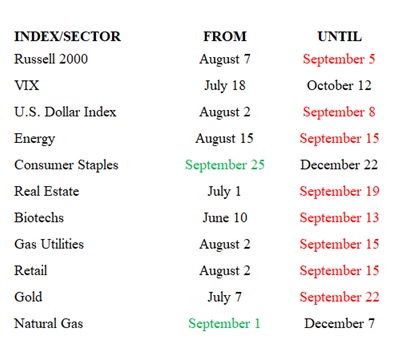
The following table shows which indexes and sectors are “in season” during the month of September. The two dates in GREEN under FROM are this month’s additions, and the eight in RED under UNTIL are this month’s expiries.
(A full list of indexes and sectors is provided at the end of this report.)
The two sectors added to the seasonality mix in September are Consumer Staples and Natural Gas. The eight sectors which end their seasonal strength in September include the Russell 2000, the U.S. Dollar Index, Energy, Real Estate, Bio-techs, Gas Utilities, Retail, and Gold.
By the way, October starts the next phase of traditional market strength, and there are 13 indexes/sectors that will be joining the following Market Segments table.
TABLE 1: Current Seasonal Positive Strengths for the Market Segments
Importance of Seasonality Trends
Utilizing the market’s historical seasonality trends can provide a useful framework for assessing and then altering the mix of one’s stock portfolio. Highly volatile markets often open up exceptional opportunities for astute investors to take advantage of market weakness to buy quality stocks that have declined in price significantly in line with the overall market downdraft. As a result, market sectors that are “in season” often provide exceptional stock-buying opportunities in such dire market conditions.
Seasonality refers to particular time-frames when stocks/sectors/indexes are subjected to and influenced by recurring tendencies that produce patterns that are apparent in the investment valuation process. A seasonality study preferably uses at least 10 years of data. Our data (courtesy of Equity Clock) is for 14 years.
Seasonality Trends Chart
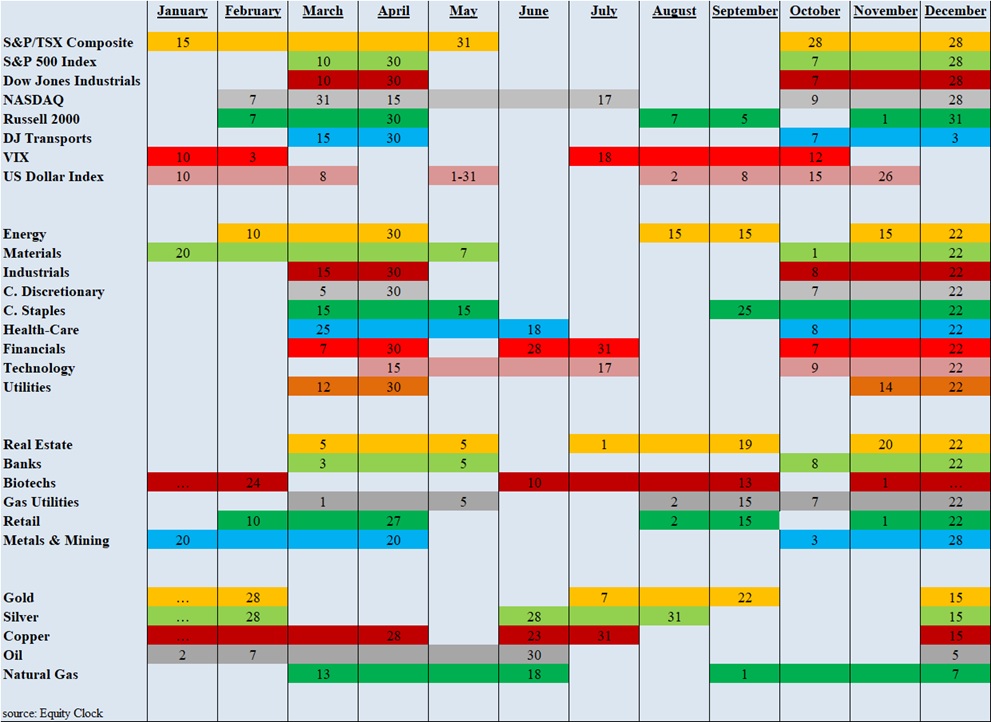
The Seasonality trends chart is an ever-changing 14-year average of the indexes and sub-indexes that we track. The charts are courtesy of www.equityclock.com.
The Seasonality Trends chart below has been updated as of May 2020. It shows the periods of seasonal strength for 28 market segments (sectors/indexes). Each bar indicates a buy and a sell date based upon the optimal holding period for each market sector/index.
TABLE 2: Seasonality Trends Chart
//