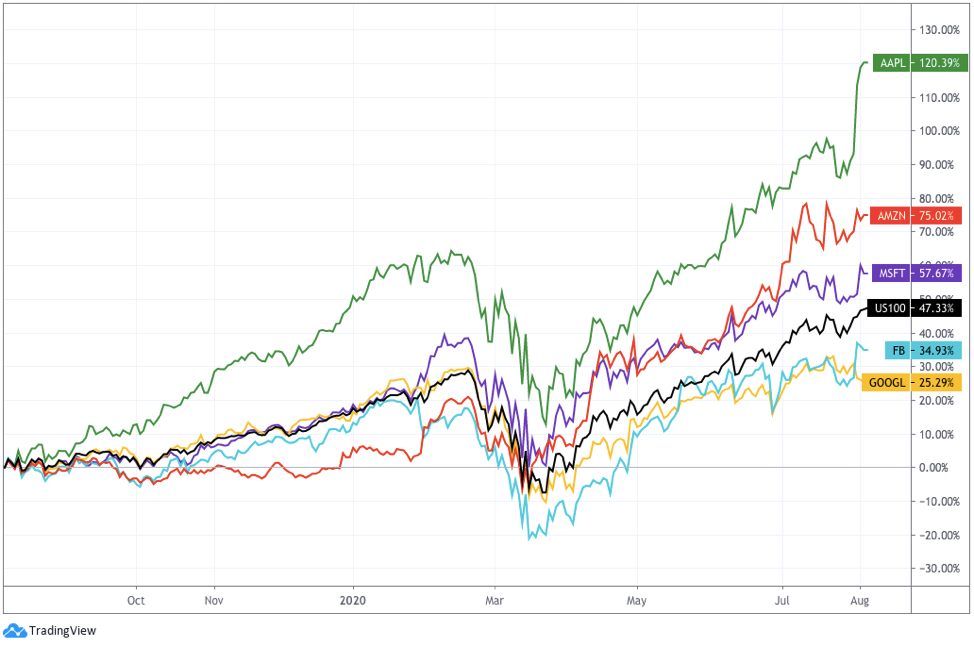
eResearch | Last week, Alphabet Inc. (NASDAQ: GOOGL), Amazon.com, Inc. (NASDAQ: AMZN), Apple Inc. (NASDAQ: AAPL), Facebook, Inc. (NASDAQ: FB), and Microsoft Corporation (NASDAQ: MSFT), reported quarterly earnings, as the big tech companies strongly outperformed against the broader market during the COVID-19 pandemic.
One day before reporting earnings, Amazon, Apple, Facebook, and Google spoke with members from Congress as part of an anti-trust investigation looking into each tech companies’ market size and monopolistic power over competition.
This past quarter, Amazon, Apple, Microsoft, and Facebook all reported positive revenue growth. However, Google posted a decline in revenue for the first time in its history due to a decline in online ad revenue.
Amazon
![]()
![]() In Q2/2020, Amazon reported Revenue of US$88.9 billion versus S&P Capital IQ analysts’ consensus estimate of US$81.3 billion, with of US$10.50 EPS smashing the estimate of only US$1.61.
In Q2/2020, Amazon reported Revenue of US$88.9 billion versus S&P Capital IQ analysts’ consensus estimate of US$81.3 billion, with of US$10.50 EPS smashing the estimate of only US$1.61.
Amazon experienced a surge in net sales, driven by Online stores, which increased net sales to US$45.9 billion, a 47.8% increase year-over-year, and Third-party seller services, which increased net sales to US$18.2 billion, a 52.1% increase year-over-year. Online stores and Third-party seller services together accounted for 72% of Amazon’s total net sales.
In the earnings call, Brian Olsavsky, CFO of Amazon, spoke on how grocery and delivery services scaled significantly as grocery delivery capacity increased by over 160%, while the number of pick-up locations tripled year-over-year.
Amazon’s higher margin cloud division, Amazon Web Services (“AWS”), reported net sales of US$10.8 billion, a 29% increase year-over-year, lower than the prior year’s 37% increase, partially due to pricing changes and more aggressive competition in the market.
Amazon’s Net Income almost doubled, mainly attributed to a significant decrease in marketing and travel expenses. However, fulfillment costs, which includes hiring costs and fulfillment network expansion costs, increased by 49% year-over-year due to COVID-19 impacts.
In the earnings release, Jeff Bezos, CEO of Amazon, said “As expected, we spent over $4 billion on incremental COVID-19-related costs in the quarter to help keep employees safe and deliver products to customers in this time of high demand – purchasing personal protective equipment, increasing cleaning of our facilities, following new safety process paths, adding new backup family care benefits, and paying a special thank you bonus of over $500 million to front-line employees and delivery partners.”
Amazon’s stock price is currently trading at US$3,139 per share, a 4.14% increase since the earnings announcement and a 78% increase in the last year.
Amazon Q2/2020 Financial Highlights
- Net sales of US$88.9 billion, a 40% increase year-over-year, which includes Net product sales of US$50.2 billion and Net service sales of US$38.7 billion.
- Operating expenses of US$83.1 billion, a 38% increase year-over-year, which mainly includes Cost of sales of US$52.7 billion, Fulfillment expenses of US$13.81 billion, Technology and content expenses of US$10.39 billion, Marketing expenses of US$4.35 billion, and SG&A expenses of US$1.58 billion.
- Capital expenses of US$9.4 billion, used towards data servers and delivery service infrastructure.
- Net income of US$5.24 billion, a 100% increase year-over-year.
- Balance sheet includes Cash, cash equivalents and Marketable securities of US$71.4 billion, Current liabilities of US$93.9 billion, and Long-term liabilities of US$90.7 billion.
Apple
![]()
![]() In FQ3/2020, Apple reported Sales of US$59.7 billion, handily beating S&P Capital IQ analysts’ consensus estimate of US$52.5 billion, with US$2.61 EPS versus the EPS estimate of US$2.07.
In FQ3/2020, Apple reported Sales of US$59.7 billion, handily beating S&P Capital IQ analysts’ consensus estimate of US$52.5 billion, with US$2.61 EPS versus the EPS estimate of US$2.07.
Apple reported product sales of US$46.5 billion, a 9.86% increase year-over-year, driven by a 31% increase in iPad sales, a 22% increase in Mac sales, and a 16.7% increase in Wearables, Home and Accessories sales. iPhone sales, which account for almost half of Apple’s total product sales, only increased by 1.66%, due to supply chains being impacted by the pandemic.
Apple reported service sales of US$13.2 billion, a 14.8% increase year-over-year, primarily due to higher sales from the App store, in addition to increases in sales from video services and cloud services, as consumers use more online services during lockdowns.
In an effort to increase accessibility for a broader investor base, Apple announced a four-for-one stock split.
Apple’s stock price is currently trading at US$438.66/share, a 16% increase since the earnings announcement and a 127% increase in the last year.
Apple FQ3/2020 Financial Highlights
- Net sales of US$59.7 billion, a 10.9% increase year-over-year, which includes iPhone sales of US$26.4 billion, Mac sales of US$7.08 billion, IPad sales of US$6.58 billion, Wearables, Home and Accessories sales of US$6.45 billion, and Services sales of US$13.2 billion.
- Cost of sales of US$37 billion, a 10.2% increase year-over-year, which include Product costs of US$32.7 billion and Service costs of US$4.31 billion.
- Operating Expenses of US$9.59 billion, a 10.4% increase year-over-year, which includes R&D costs of US$4.76 billion and SG&A costs of US$4.83 billion.
- Net income of US$11.3 billion, a 12% increase year-over-year.
- Balance sheet includes Cash, Cash equivalents, and Marketable Securities of US$93 billion, Current liabilities of US$95.3 billion, and Long-term liabilities of US$150 billion.
![]()
![]() In Q2/2020, Facebook reported revenues of US$18.7 billion also beating S&P Capital IQ analysts’ consensus estimate of US$17.4 billion; EPS was US$1.82 versus the EPS consensus estimate of US$1.37.
In Q2/2020, Facebook reported revenues of US$18.7 billion also beating S&P Capital IQ analysts’ consensus estimate of US$17.4 billion; EPS was US$1.82 versus the EPS consensus estimate of US$1.37.
User activity surged for Facebook’s social media platform and family of apps, as consumers spent more time at home due to the pandemic. Facebook grew the social media platform’s Monthly Active Users (“MAU”) to 2.7 billion, a 12% increase year-over-year, while it grew the family of apps Monthly Active People (“MAP”) to 3.14 billion, a 13.8% increase year-over-year.
Advertisement revenue grew to US$18.3 billion, a 10% increase year-over-year, as Facebook increased the number of advertisement impressions delivered by 40%, year-over-year. However, the increase in advertisement volume was due to a 21% decrease in average price per advertisement, year-over-year, as global advertisement demand dropped due to the pandemic.
Facebook’s “Other” revenue stream, which includes sales of its Oculus virtual reality headsets, increased by 40%, year-over-year.
Facebook’s stock price is currently trading at US$249.83/share, a 7.96% increase since the earnings announcement and a 37.5% increase in the last year.
Facebook Q2/2020 Financial Highlights
- Revenue of US$18.7 billion, a 10% increase year-over-year, which mainly includes Advertising sales of US$18.3 billion.
- Costs and expenses of US$12.7 billion, a 3.78% increase year-over-year, which includes Cost of revenues of US$3.83 billion, R&D costs of US$4.46 billion, Marketing and sales costs of US$2.84 billion, and General and administrative costs of US$1.59 billion.
- Capital expenditures of US$3.4 billion, driven by investments in data centres, office buildings, and network infrastructure.
- Net income of US$5.18 billion, a 98% increase year-over-year.
- Balance Sheet includes Cash, cash equivalents, and Marketable securities of US$58.2 billion, Current liabilities of US$11.3 billion, and Long-term liabilities of US$17.9 billion.
 In Q2/2020, Google reported revenues of US$38.3 billion, slightly beating S&P Capital IQ analysts’ consensus estimate of US$37.4 billion, with US$10.13 EPS versus EPS consensus estimate of US$8.21
Google experienced a decrease in revenue mainly due to advertisement sales dropping to US$29.9 billion, an 8% decrease year-over-year, due to searches trending towards less commercial topics which resulted in lower advertisement spending. Advertisement sales account for 77.9% of Google’s total revenues.
However, Google’s cloud sales increased to US$3 billion, a 43.2% increase year-over-year, as more corporations transitioned online due to the pandemic. Google Cloud’s growth was primarily driven by the Google Cloud Platform, which includes infrastructure and data analytics services, and G Suite, a group of cloud-based productivity tools.
In addition, Google’s “Google other” segment reported sales of US$5.12 billion, a 25.6% increase, year-over-year. The “Google other” segment includes sales from the Google Play app store and the non-advertising portion of the YouTube platform, which both surged in demand as more consumers stayed home during lockdowns.
Google’s stock price is currently trading at US$1,473.30/share, a 1.48% decrease since the earnings announcement and a 27.6% increase in the year.
Google Q2/2020 Financial Highlights
- Revenue of US$38.3 billion, a 2% decrease year-over-year, which include Google advertising sales of US$29.9 billion, Google cloud sales of US$3 billion, Google other sales of US$5.12 billion, and Other bets sales of US$148 million.
- Cost and expenses of US$31.9 billion, a 7.22% increase year-over-year, which includes Cost of revenues of US$18.5 billion, R&D costs of US$6.88 billion, Sales and marketing costs of US$3.9 billion, and General and administrative costs of US$2.59 billion.
- Capital expenses of US$5.4 billion, used towards data centres and servers.
- Net income of US$6.96 billion, a 30% decrease year-over-year.
- Balance sheet consists of Cash, cash equivalents, and Marketable securities of US$121 billion, Current liabilities of US$43.7 billion, and Long-term debt of US$27.5 billion.
Microsoft
![]()
![]()
In FQ4/2020, Microsoft reported revenues of US$38.1 billion versus S&P Capital IQ analysts’ consensus estimate of US$36.5 billion, with US$1.48 EPS versus consensus estimate of US$1.37.
Microsoft reported positive revenue growth for all its segments including Productivity and business processes, Intelligent Cloud, and More personal computing, increasing sales year-over-year by 6%, 17%, and 14%, respectively.
In the Productivity and business processes segment, Microsoft’s core platform, Office 365, reported increased sales in the commercial segment by 19%, year-over-year, and the consumer segment by 23%, year-over-year. Office 365 currently has over 40 million consumer subscribers and over 258 million business subscribers to date.
The Intelligent cloud segment was Microsoft’s fastest growing segment, driven by the Azure cloud platform, which increased revenue by 47%. However, Microsoft Azure’s growth rate is on a constant downtrend, as it reported a 65% growth rate the prior year and an 89% growth rate two years ago.
Microsoft’s More personal computing segment experienced significant growth in Xbox content services, which increased sales by 65% year-over-year, as more consumers stayed indoors and played games during the pandemic.
Microsoft’s stock price is currently trading at US$213.29/share, a 0.73% increase since the earnings announcement and a 61.3% increase in the LTM.
Microsoft FQ4/2020 Financial Highlights
- Revenue of US$38.1 billion, a 13% increase year-over-year, which include Productivity and business processes sales of US$11.8 billion, Intelligent cloud sales of US$13.4 billion, and More personal computing sales of US$12.9 billion.
- Operating expenses of US$12.3 billion, a 13% increase year-over-year, driven by cloud investments, charges from closing physical stores, and increases in bad debt expenses.
- Capital expenditures of US$5.8 billion, mainly used towards scaling cloud infrastructure and servers.
- Net Income of US$11.2 billion, a 15% decrease year-over-year.
- Balance sheet consists of Cash, cash equivalents, and Short-term investments of US$137 billion, Current liabilities of US$72.3 billion, and Long-term liabilities of US$111 billion.
CHART 1: NASDAQ 100 vs AMZN (red), AAPL (green), FB (blue), GOOGL (yellow), and MSFT (purple) – 1-Year Stock performance
Last quarter’s eResearch tech update article:
//