eResearch | We continue to monitor four indicators to help guide us through the stock market volatility:
- CBOE Volatility Index (VIX)
- S&P 500 Chart of the 2008-2009 Recession with today’s S&P 500 mapped over it.
- S. Coronavirus New Cases
- S. Seasonally Adjusted Weekly Unemployment Claims
The CBOE Volatility Index (VIX) remains in the “High Volatility” range and the S&P 500 index was down 2.3% as Unemployment Claims reached over 33 million and Coronavirus cases hit a new high during last week.
1) VIX: S&P 500 Market Volatility Index
| This week: 28.2 | Last week: 31.9 | 2 weeks ago: 28.0 | 3 weeks ago: 37.2 |
| Remains in the “High Volatility” range. | |||
| Why it is important: The VIX index measures the market’s expectation for the 30-day forward-looking volatility and is derived from the S&P 500 index options. | |||
| Below 12: Low volatility | 12 to 20: Normal volatility | Above 20: High volatility | |
CHART 1: VIX Index Chart – Year-to-Date – Currently at 31.9 Higher than 28.0 Last Week
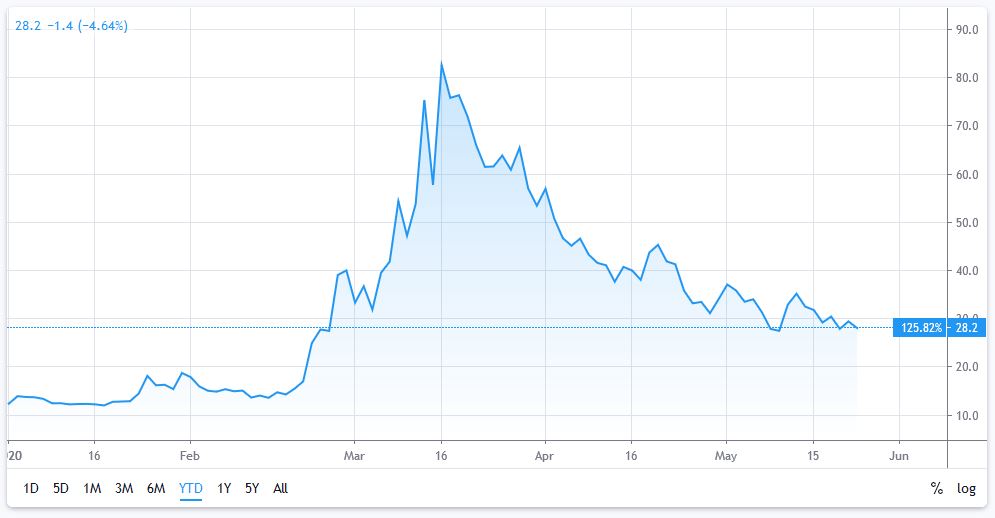
The VIX reversed the upward trend and closed below 30, indicating the market may not be as volatile over the next 30 days. However, it is still in the “High Volatility” range.
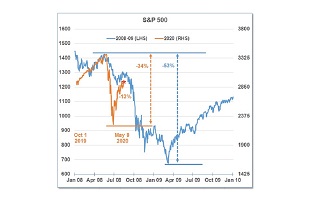
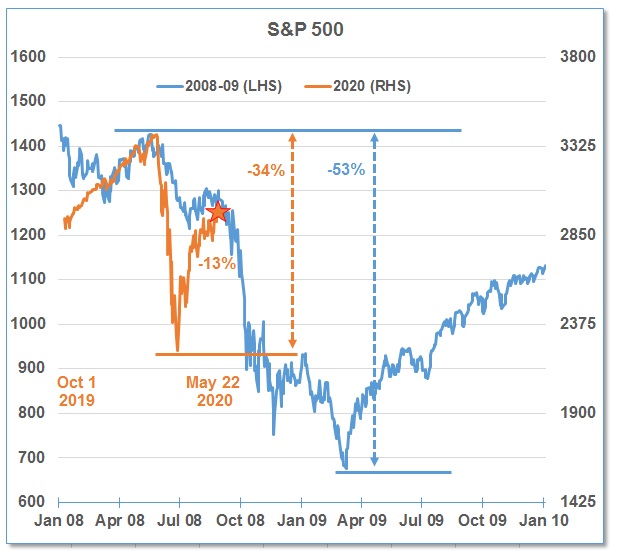
2) S&P 500 Chart
The S&P 500 closed up 3.2% on the week following gains of over 30% in the past 2 months and is now up 1.4% in May and 8.0% YTD.
In the chart below, we have overlaid the stock market since October 2019 on top of the stock market during 2008-09 during the financial crisis.
- The S&P 500 was up over 3% last week and closed at 2,955.45, still down almost 13% from the high of 3386 on February 19.
- At the recent bottom, the S&P 500 was down almost 34% from its peak in February.
- During the 2008-09 Financial Crisis recession, the S&P 500 dropped 53%.
- With “bottom buyers” making stock purchases during the first drop and the shorts covering, the current rebound is stalling and there remains a potential for another drop in the North American indices even after the U.S. economy re-starts.
CHART 2: Current S&P 500 Index Mapped Over the Chart of the S&P 500 from 2008-2009
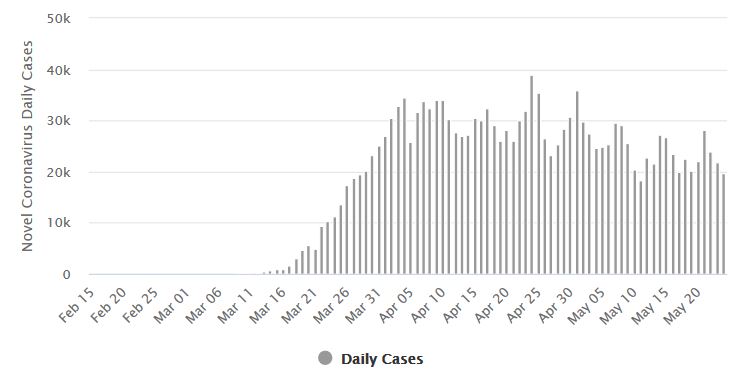
3) U.S. Coronavirus New Cases
The U.S. passed 1.6 million cases this week and added another 10,000 deaths to reach over 100,000 deaths.
Brazil leapt over Russia this week into the #2 place in Total Cases with over 365,000.
In the U.S., the number of daily new cases remained firm this week to around 20,000. The peak remains on April 24 with 39,000 new cases.
Although the U.S. continues to be the country with the highest number of coronavirus-related deaths, the data continues to show the U.S. death rate is growing at a decreasing rate, perhaps illustrating that social distancing is reducing the spread. However, with states re-opening in the Memorial Day long weekend, expect a jump in the number of new cases.
CHART 3: Daily New Cases of COVID-19 in the United States
4) U.S. Seasonally Adjusted Weekly Unemployment Claims
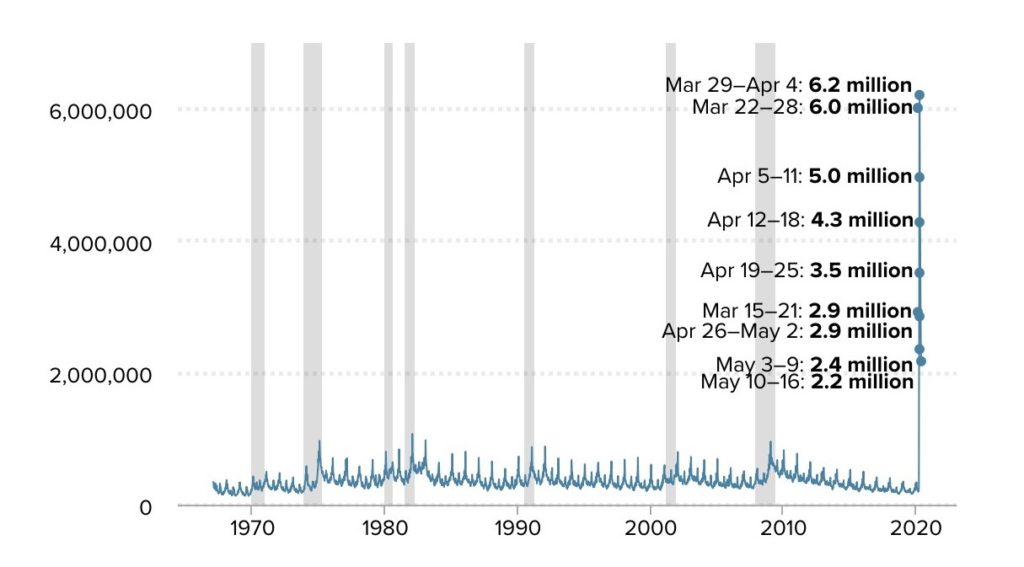
Last week, 2.2 million Americans applied for unemployment benefits as the widespread layoffs caused by the COVID-19 pandemic crisis continued.
This amount is slightly lower than 2.6 million, from the previous week. Unemployment claims peaked at over 6.2 million during the March 29 – April 4 period.
The recent nine-week total is now almost 35.4 million. The latest job losses have pushed the unemployment rate to 14.7% (May 8), the highest rate since the Great Depression and wipes out all of the job gains since 2000. Analysts Goldman Sachs now estimate that the U.S. unemployment rate could rise to above 25%
As previously noted, some economists expected 15-25 million Americans would likely be laid off or furloughed before the economy recovers from the coronavirus impact and this estimate has now been surpassed.
CHART 4: U.S. Seasonally Adjusted Weekly Unemployment Claims
//