We continue to monitor four indicators to help guide us through the stock market volatility:
- CBOE Volatility Index (VIX)
- S&P 500 Chart of the 2008-2009 Recession with today’s S&P 500 mapped over it.
- S. Coronavirus New Cases
- S. Seasonally Adjusted Weekly Unemployment Claims
The CBOE Volatility Index (VIX) remains in the “High Volatility” range and the S&P 500 index was down 1.3% as Unemployment Claims reached almost 25 million and new Coronavirus cases hit a new high during last week.
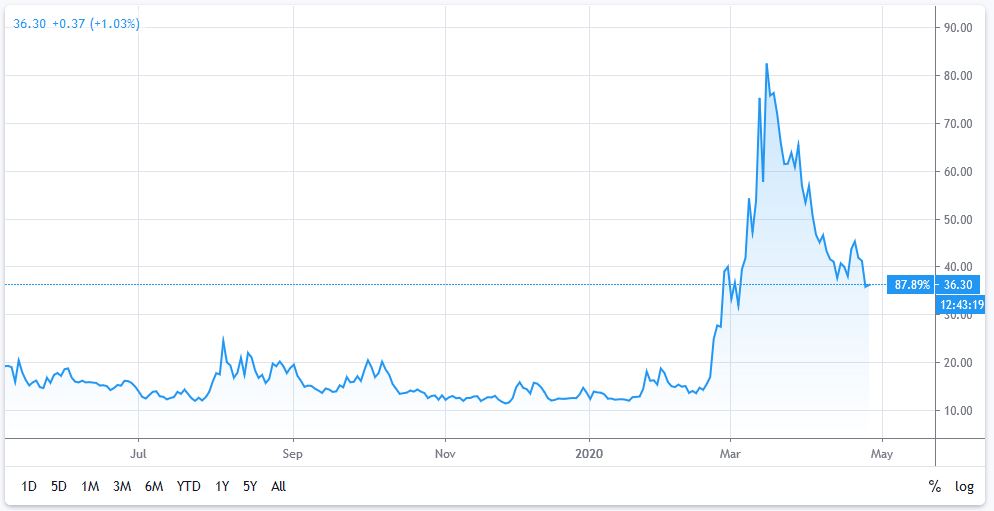
1) VIX: S&P 500 Market Volatility Index
| This week: 36.3 | Last week: 38.2 | 2 weeks ago: 41.7 | 3 weeks ago: 46.8 |
| Remains in the “High Volatility” range. | |||
| Why it is important: The VIX index measures the market’s expectation for the 30-day forward-looking volatility and is derived from the S&P 500 index options. | |||
| Below 12: Low volatility | 12 to 20: Normal volatility | Above 20: High volatility | |
CHART 1: VIX Index Chart – Year-to-Date – Currently at 36.3 Slightly Down from 38.2 Last Week
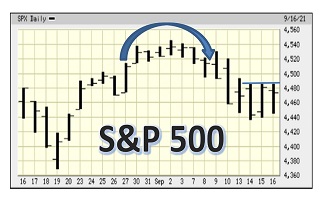
2) S&P 500 Chart
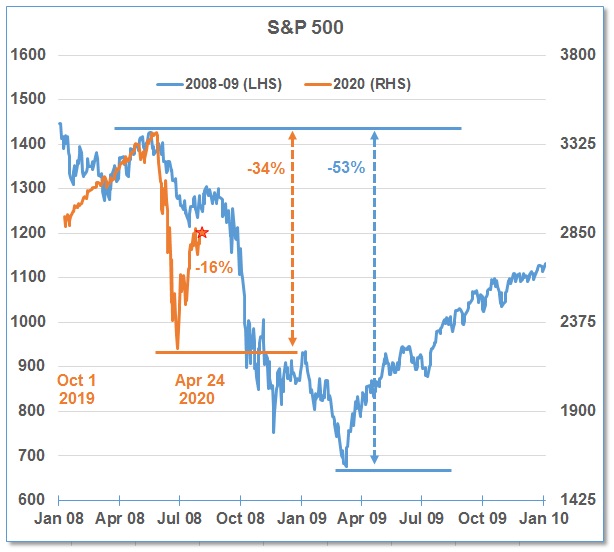
The S&P/TSX Composite was relatively flat last week with the U.S. exchanges slightly down and oil hitting a wall, down almost 32% on over-supply and potential storage issues. In the chart below, we have overlaid the stock market since October 2019 on top of the stock market during 2008-09 during the financial crisis.
- The S&P 500 was down 1.3% last week and is at 2837, down 16% from the high of 3386 on February 19.
- At the recent bottom, the S&P 500 was down almost 34% from its peak in February.
- During the 2008-09 Financial Crisis recession, the S&P 500 dropped 53%.
- There is concern about the potential for another drop in the North American indices as the full effects of the shutdowns and shut-ins percolate through the economy.
CHART 2: Current S&P 500 Index Mapped Over the Chart of the S&P 500 from 2008-2009
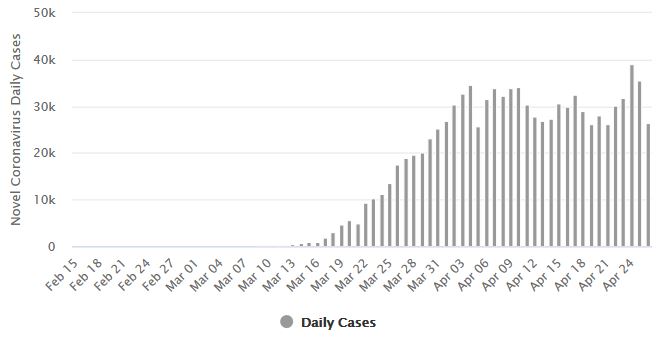
3) U.S. Coronavirus New Cases
Previously, the number of daily new cases in the United States peaked around April 3 at over 34,000 cases reported per day but this week, on April 24, hit a new high of almost 39,000 new cases before declining slightly at the end of the week.
The U.S. continues to be the country with the highest number of coronavirus-related deaths, now at over 55,000, more than double that of Italy, but the U.S. death rate is now decreasing.
Some states have begun the process of re-opening the economy to get some employees back to work, and as protests continued over the closure of the economy. The debate continues on whether it is too soon to re-start the economy.
CHART 3: Daily New Cases of COVID-19 in the United States
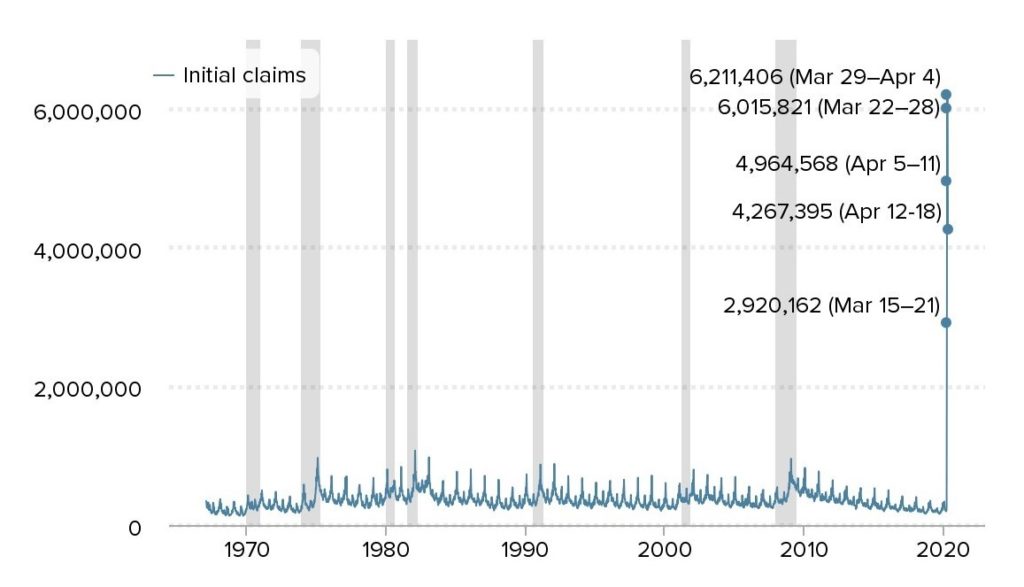
4) U.S. Seasonally Adjusted Weekly Unemployment Claims
Last week, 4,267,395 Americans applied for unemployment benefits as the widespread layoffs caused by the COVID-19 pandemic crisis continued.
This amount is lower than 4.96 million from the previous week. Unemployment claims peaked at over 6.2 million during the March 29 – April 4 period.
The recent five-week total is now almost 24.4 million. The continued surge in new unemployment claims was not a surprise as stay-at-home measures now reached 99% of Americans.
As previously noted, some economists expected 15-25 million Americans would likely be laid off or furloughed before the economy recovers from the coronavirus impact.
CHART 4: U.S. Seasonally Adjusted Weekly Unemployment Claims
//