Last week we posted an article “Will the Stock Market Bounce Be a “V” or “W” Shaped Recovery?”
This week we will be looking at four primary indicators to help guide us through these troubled times:
- CBOE Volatility Index (VIX)
- S&P 500 Chart of the 2008-2009 Recession with today’s S&P 500 mapped over it.
- U.S. Coronavirus New Cases
- U.S. Seasonally Adjusted Weekly Unemployment Claims
1. VIX:
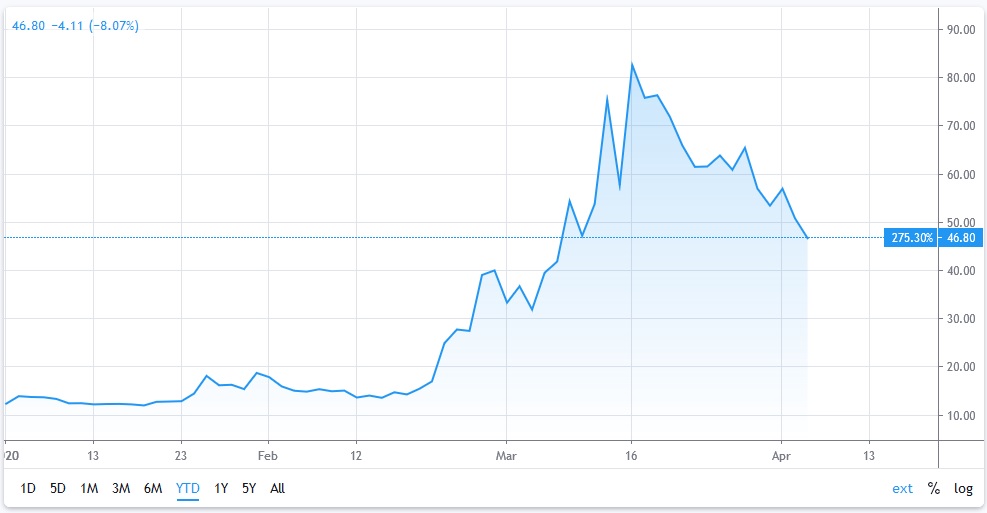
- One indicator for the market volatility is the VIX index.
- The VIX index measures the market’s expectation for the 30-day forward-looking volatility and is derived from the S&P 500 index options.
- VIX ranges:
- Below 12: Low volatility
- Between 12 and 20: Normal volatility
- Above 20: High volatility
- The VIX closed the week at 46.8, down from last week’s close of 65.5, but still indicating a very volatile stock market.
CHART 1: VIX Index Chart – Year-to-Date – Currently 46.8 Down from 65.5 Last Week
2. S&P 500 Chart
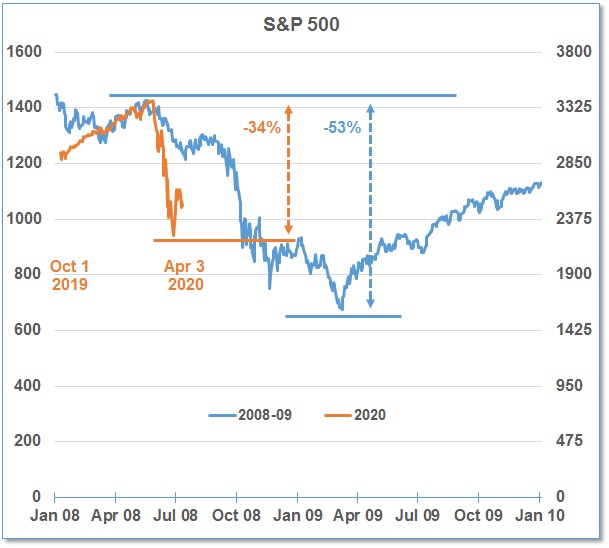
There is speculation that this stock market recovery is not going to be “V” shaped but more likely, we will experience a “W” shaped recovery.
In this chart, we have overlaid the stock market since October 2019 on top of the stock market during 2008-09 during the financial crisis. Currently the S&P 500 is down 34% from its peak in February. During the 2008-09 Financial Crisis recession, the S&P 500 dropped 53%. In the current market, the S&P 500 dropped further faster but that does not mean we will have a faster recovery.
CHART 2: Current S&P 500 Index Mapped Over the Chart of the S&P 500 from 2008-2009
3. U.S. Coronavirus New Cases
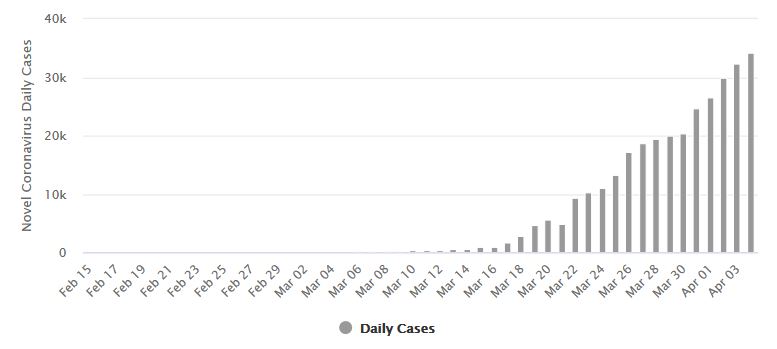
The number of daily new cases in the United States continues to rise, now over 34,000 cases reported per day. If the U.S. doesn’t reduce the daily climb of new cases, the sick will overwhelm the hospitals. With three out of four Americans under some sort of lock down, the negative economic impact will continue and the stock markets will be under downward pressure.
CHART 3: Daily New Cases of COVID-19 in the United States
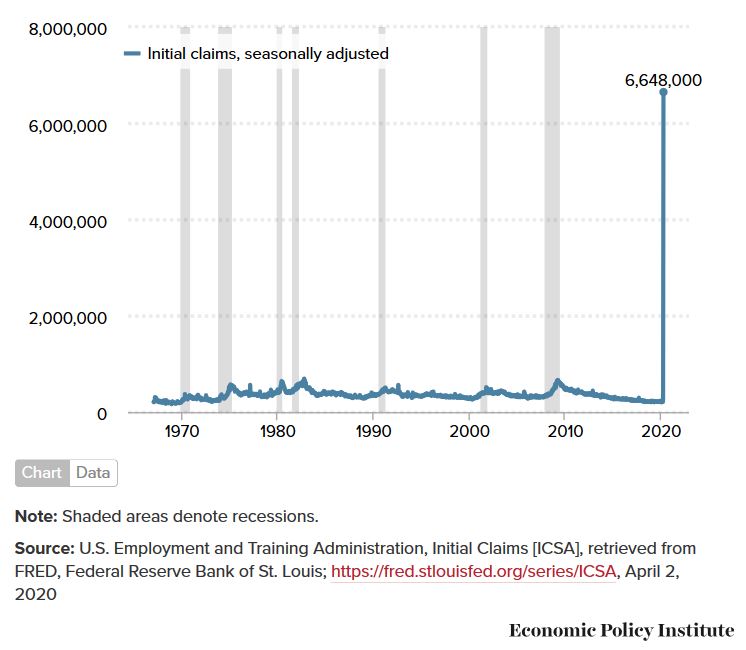
4. U.S. Seasonally Adjusted Weekly Unemployment Claims
Last week, 6,648,000 Americans applied for unemployment benefits as the widespread layoffs caused by the COVID-19 pandemic crisis continued.
This marks the highest level of Unemployment Claims in the history of Unemployment Claims and an increase of over 3.3 million from the previous week that was the previous record.
The surge in new unemployment claims was not a surprise as stay-at-home measures intensified over the past week and employers started to lay off employees. Some economists expect 15-25 million Americans will likely be laid off or furloughed before the economy recovers from the coronavirus impact.
CHART 4: U.S. Seasonally Adjusted Weekly Unemployment Claims
//