When using technical analysis in the stock market, transitions between rising and falling prices often form patterns or trends.
When the pricing pattern continues on the same trend, it is called a continuation and when the trend changes, it is known as a reversal. Trends can be upwards (up trends), downwards (down trends) or side ways (consolidation) and the trends are used to predict future prices.
Even after last week’s record gains, the major North American indices are all in Bear market territory, being down more than 20% from the recent highs.
Some market pundits are looking for a “V” shape recovery where the stock prices decline sharply only to rise sharply and form a chart pattern that looks like a “V”.
However, in the past, sharp downturns have often led to short-term rebounds, often known as the “dead cat” bounce or “false” recovery.
It would not be surprising to see the North American indices test their recent lows as, historically, this pattern has happened in previous bear markets.
This would then lead to the “W” shaped pattern – a pattern with one or more periods of stock price increases and decreases to form the “W” shape. A “W” shaped market is usually accompanied by a period of extreme volatility.
VIX – Market Volatility Index
One indicator for the market volatility is the VIX index. The VIX index measures the market’s expectation for the 30-day forward-looking volatility and is derived from the S&P 500 index options.
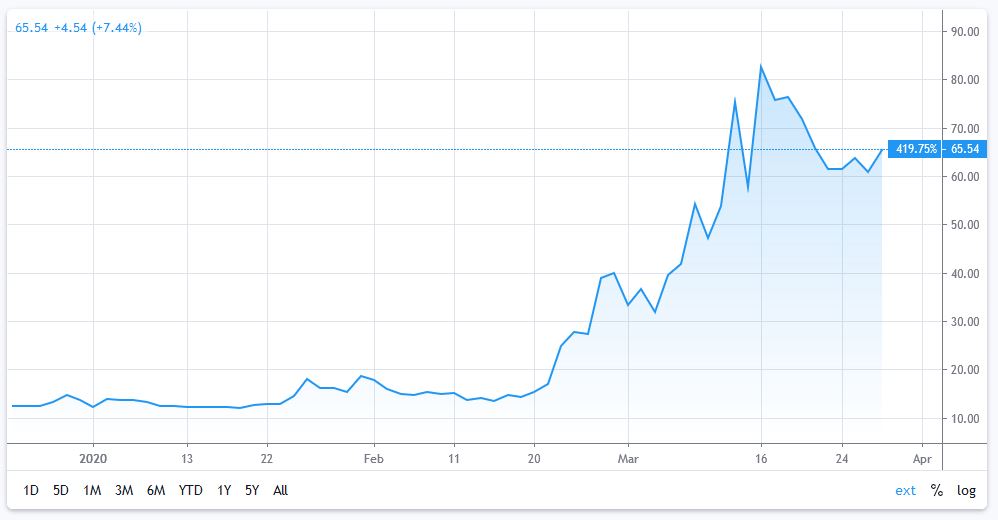
One interpretation of the VIX ranges has a VIX level below 12 to be “low”, a level between 12 and 20 to be “normal”, and above 20 to be “high”. Currently the VIX is over 65 and therefore still indicating a very volatile market.
CHART 1: VIX Index Chart – Year-to-Date – Currently over 65
Coronavirus in the United States
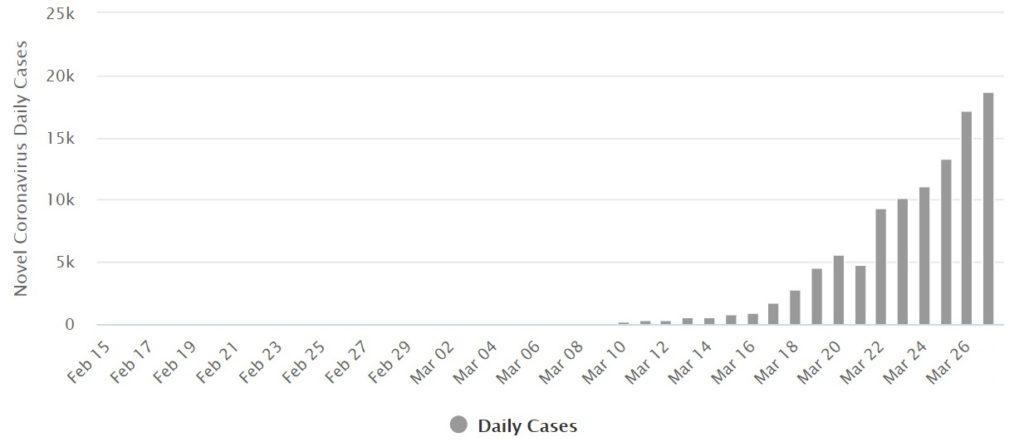
As the number of daily new cases in the United States continues to rise, the negative economic impact will continue and the stock markets will be under downward pressure.
CHART 2: Daily New Cases of COVID-19 in the United States
In a March 25 article on Forbes.com, Clem Chambers speculated that this is not going to be a “V” shaped stock market crash. He believes this crisis is going to “bake” problems (e.g., various bailout strategies) into the global economy that might take months or even years to resolve.
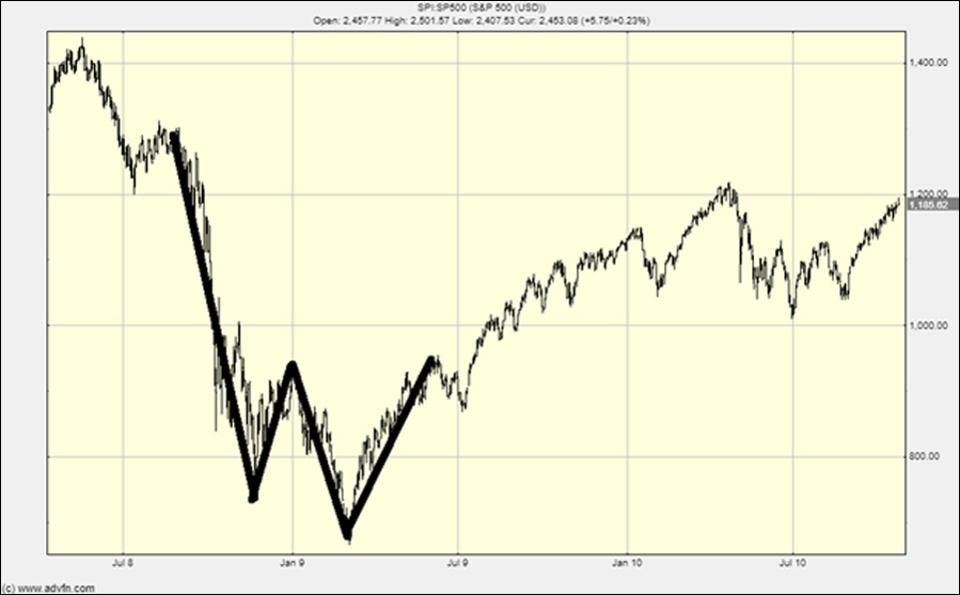
Mr. Chambers believes the “V” shaped recoveries are rare and it is more likely we will experience a “W” shaped recovery. Two examples are in 2002 and 2008-09.
CHART 3: “W” Shaped Recover 2002
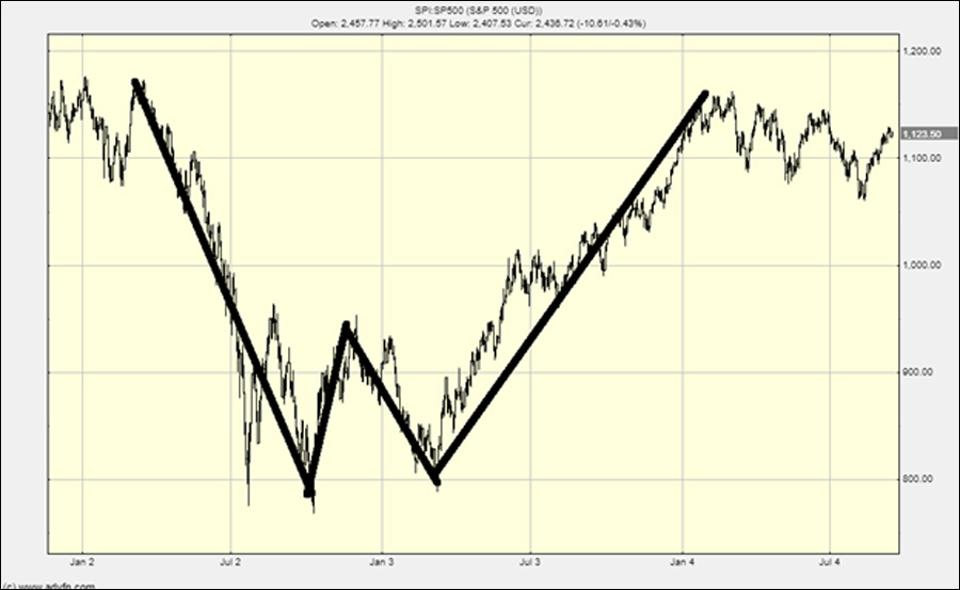
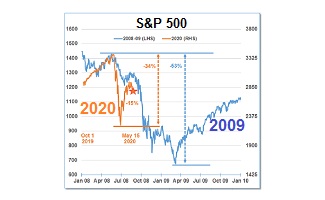
CHART 4: “W” Shaped Recover 2008-09
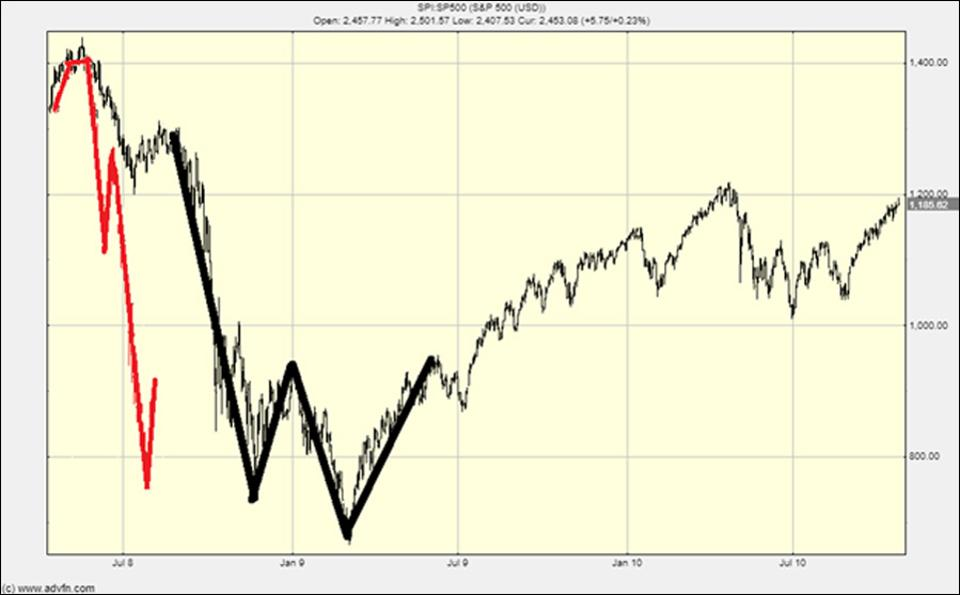
And, the red line is the recent S&P 500, from peak to where we are today, overlaid on the 2008-09 chart.
CHART 5: “W” Shaped Recover 2008-09 with Recent S&P 500 Overlay in Red
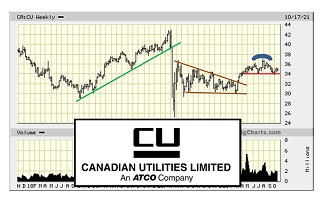
Mr. Chambers admitted that he has been buying into the drop but is holding back 50% to wait and see if the indices test the lows again. To further protect his investments, he is focusing on dividend paying, blue-chip companies with great cash flows, solid balance sheets and a history of dividends.
Mr. Chambers believes that the next year will be “incredibly bumpy” for the stock markets because of the large amount of government money flowing in to support the economy, coupled with corporate losses.
However, he has a dire warning: if the “global lockdown” goes on past April, shutting down the world economy for that long might collapse it and “no amount of money printing will avoid that.”
Bottom line, as an investor, if you return to the market too soon, you could be fooled by a false recovery, especially in times such as these that are unpredictable due to the Novel Coronavirus.
//