eResearch | The Dividend-Income Portfolio launched on December 1 and responded well after its first week of existence. The Portfolio was capitalized at $500,000 and consists of 10 equally-weighted stocks taken from a select list of 28 high dividend payers. The cut-off yield for selection to the Portfolio was 4%.
Initial Portfolio
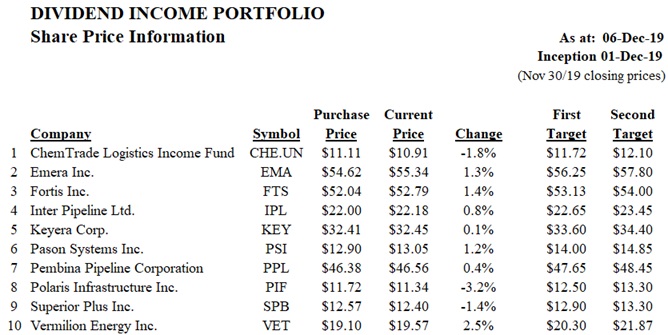
The 10 stocks that comprise the Portfolio at inception are shown below.
Comparables
We have included 5 ETFs as comparables (which also are actively traded and, so, could have been included in the Portfolio) and the S&P/TSX Composite Index to serve as benchmarks for our Portfolio’s performance. These are as follows:

Portfolio Performance
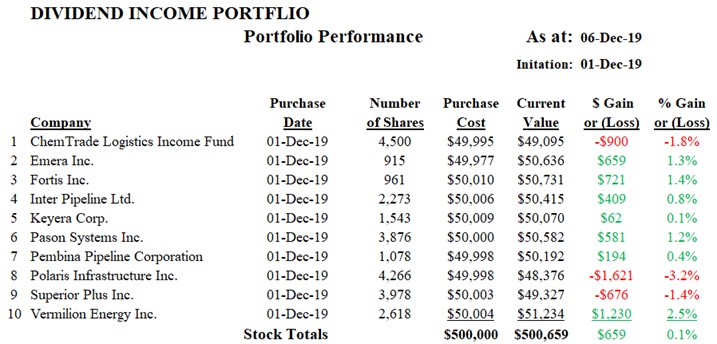
The next table shows the Portfolio’s performance after the first week.
Dividends and Yields
The table set out below shows relevant information regarding annual dividend amounts, associated yields, ex-dividend dates and payment dates for the stocks in the Portfolio as well as for the ETF comparables. The yield on the Dividend Growth Split Corp. is not a “typo”.
You can read our entire report here: Dividend Portfolio 12-06-2019