eResearch│ We have created a portfolio of high-payout common stocks that is focused primarily on attractive dividend yields but with some capital growth potential.
NOTE: The Top-Ten Dividend Yield Portfolio is designed with a longer-term perspective. As such, henceforth, we will update it every month, using Friday’s closing prices. Essentially, it will be a Buy-and-Hold portfolio, with minimal trading involved. The Portfolio will be appropriately invested but, if circumstances warrant, there could be a sizable cash component. The Portfolio was initiated on June 1, 2021, with a full complement of ten stocks. The initial investment, at inception, was $500,000.
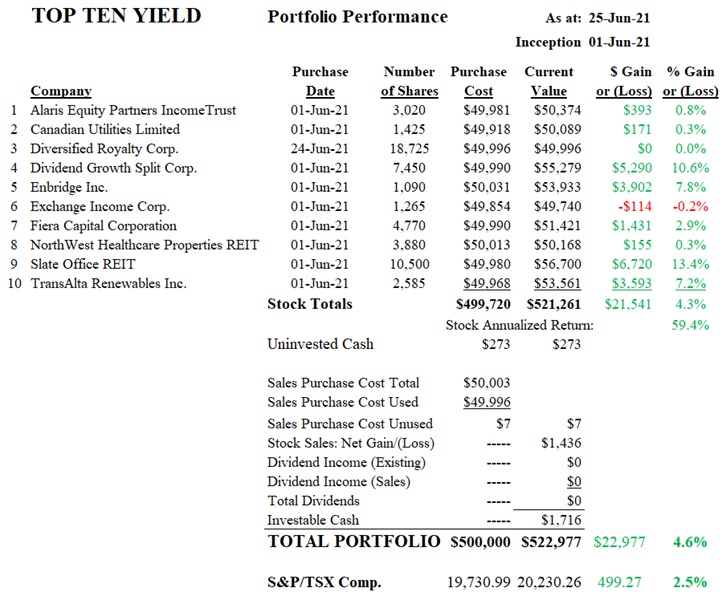
TODAY’S COMMENT: The value of the Portfolio on June 25 was $522,977, up 1.2% from the $516,655 value recorded two weeks ago, and up 4.6% since its inception on June 1. For comparative purposes, the S&P/TSX Composite Index gained 0.5% in the last two weeks and 2.5% since inception.
The portfolio is presented below.
TABLE 1: Top Ten Yield Portfolio
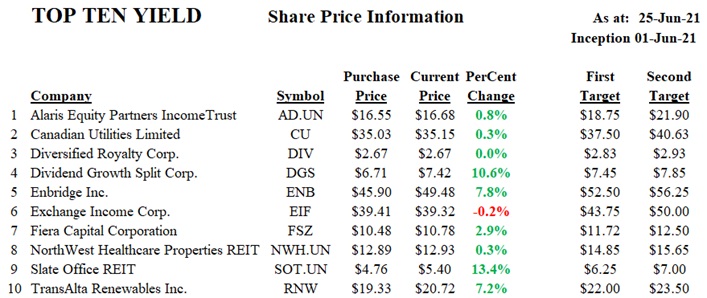
COMMENT: Two weeks ago, the slate was all GREEN. Today, there is one stock, Exchange Income Corporation, that is in the RED, by a measly 0.2%. Also, we have made a change. With the recent dividend announcement by Horizons Marijuana Life Sciences ETF (HMMJ), its annual indicated dividend, based upon the last four quarterly payments, has dropped drastically to $0.18 per share. This results in a current yield of 1.7% and well below our cut-off level of 4.0%. We replaced HMMJ with Diversified Royalty Corp. (DIV), which has a current yield of 7.6%.
The performance of these stocks is provided in the following table.
TABLE 2: Portfolio Performance
COMPARABLES
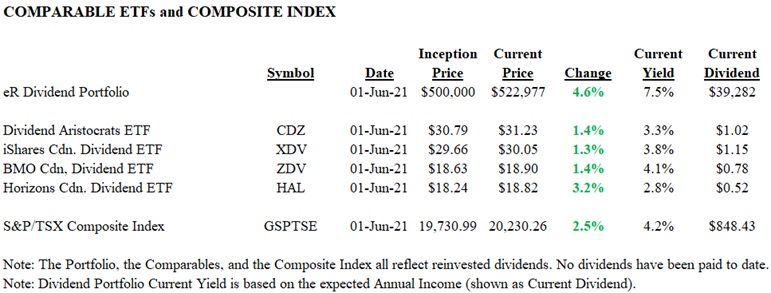
We compare the performance of the Portfolio against selected higher-yield ETFs as well as the S&P/TSX Composite Index.
Since the Portfolio’s inception on June 1, 2021, the Portfolio is up 4.6%, while the comparables range between 1.3% and 3.2%. The S&P/TSX Composite Index is ahead by 2.5%.
CHART 1: Portfolio Comparables
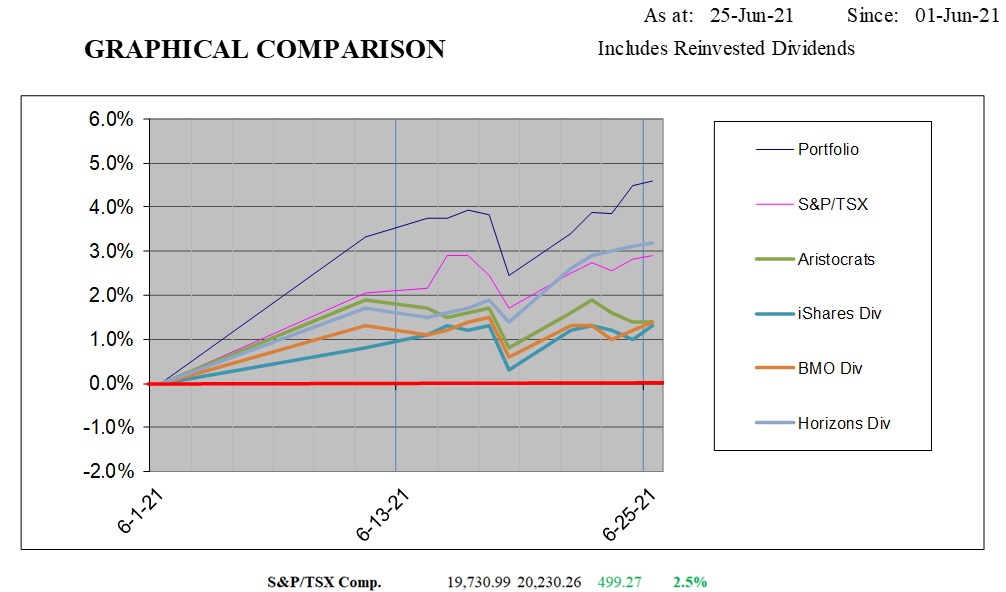
TABLE 3: Comparable ETFs and Composite Index
DIVIDEND INCOME/YIELD
Below, we provide a table that indicates the annual dividend, the corresponding annual income and current equity yields, and the dividend pay-outs to date since inception (none to date). Although there have not been any dividend payments received as yet, there are five stocks making payments in July. These are shown in Green in the following table.
TABLE 4: Annual Income and Yield

STOCKS SOLD
TABLE 5: Stock Sold

PORTFOLIO CANDIDATES
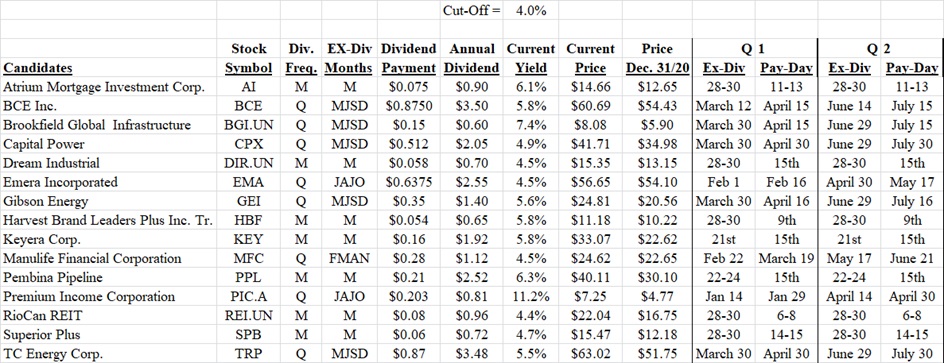
We provide a table below of fifteen stocks that also are high-yield dividend-paying stocks, all with current yields exceeding 4.0%. Diversified Royalty Corp. was included in this list until it replaced Horizons Marijuana Life Sciences ETF recently. Any of these could fit into our current portfolio. Some of them did not make it because they have gained significantly in price over the past six months and we are concerned that they might drop back disproportionately if there is a market pull-back any time soon.
TABLE 6: Other High-Yield Dividend-Paying Stocks
COMPANY DESCRIPTIONS
Alaris Equity Partners Income Trust (TSX: AD.UN)
Alaris Equity Partners Income Trust, through its subsidiaries, provides alternative financing to private companies (its “Partners”) in exchange for distributions, dividends, or interest with the principal objective of generating stable and predictable cash flows for distribution payments to its unitholders. Payments from the Partners are adjusted annually based on the percentage change of a “top-line” financial performance measure, such as gross margin or same-store sales, and rank in priority to the owner’s common equity position.
Year 2020 2019 2018 2017 2016
Earnings Per Share $0.56 $0.99 $1.67 $0.33 $1.83
Dividends Per Share $1.32 $1.65 $1.62 $1.62 $1.62
Coverage (times) 0.42x 0.60x 1.03x 0.20x 1.13x
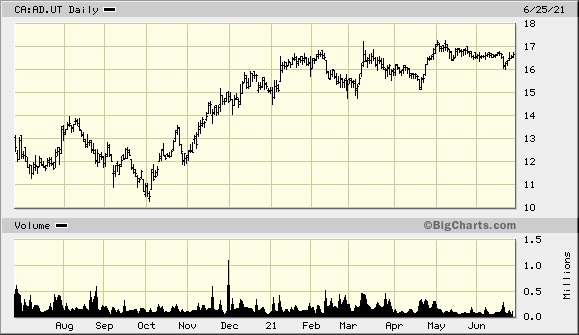
CHART 2: Alaris One-Year Chart
Canadian Utilities Limited (TSX: CU)
Canadian Utilities Limited is 52.3% owned by holding company, ATCO Limited. Canadian Utilities is a diversified global energy infrastructure company. It delivers essential services and innovative business solutions to the following industries: (1) Utilities, which includes electricity, and natural gas transmission and distribution, as well as international electricity operations; (2) Energy Infrastructure, in which it is involved in electricity generation, energy storage, and industrial water solutions; and (3) Retail Energy, which consists of electricity and natural gas retail sales. The Company has approximately 4,470 employees. Its assets comprise about $20 billion.
Year 2020 2019 2018 2017
Earnings Per Share $1.96 $2.23 $2.24 $2.23
Dividends Per Share $1.74 $1.69 $1.57 $1.43
Coverage (times) 1.13x 1.32x 1.43x 1.56x
Note: The indicated annual dividend for 2021 is $1.76.
FIGURE 1: Canadian Utilities Record of Dividend Growth

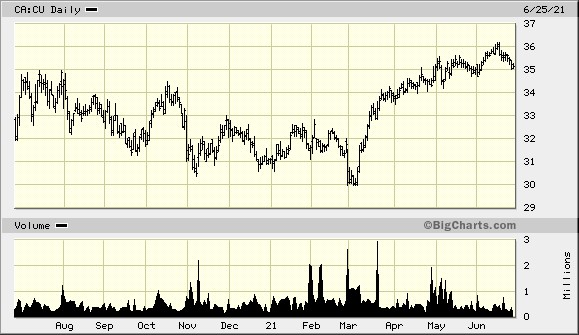
CHART 3: Canadian Utilities One-Year Chart
Diversified Royalty Corp. (TSX: DIV)
Diversified Royalty Corp. (the “Company”) is a multi-royalty corporation engaged in the acquisition of top-line royalties from well-managed multi-location businesses and franchisors in North America. The Company’s objective is to acquire predictable, growing royalty streams from a diverse group of multi-location businesses and franchisors. The Company currently owns the trademarks for Mr. Lube, AIR MILES®, Sutton, Mr. Mikes, Nurse Next Door, and the Oxford Learning Centres. Diversified Royalty expects to increase cash flow per share by making accretive royalty purchases and through the growth of purchased royalties. The Company expects to pay a predictable and stable dividend to shareholders and increase the dividend as cash flow per share increases allow.
Year 2020 2019 2018 2017 2016
Distributable Cash Flow Per Share $0.20 $0.21 $0.19 $0.16 $0.21
Dividends Paid Per Share $0.21 $0.22 $0.22 $0.22 $0.22
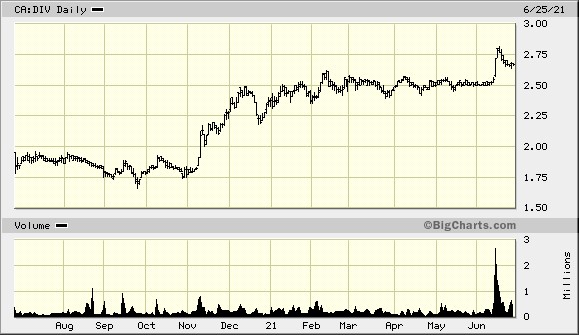
CHART 4: Diversified Royalty One-Year Chart
Dividend Growth Split Corp. (TSX: DGS)
Dividend Growth Split Corp. (the “Company”) is a mutual fund corporation managed by Brompton Funds Limited (the “Manager”). Dividend Growth Split Corp. invests in a portfolio (the “Portfolio”) consisting primarily of equity securities of Canadian dividend growth companies. The Company may hold up to 20% of the total assets of the Portfolio in global dividend growth companies for diversification and improved return potential, at the discretion of Brompton Funds Limited. To qualify for inclusion in the Portfolio, at the time of investment and at the time of each periodic reconstitution and/or rebalancing, each dividend growth company included in the Portfolio must have (1) a market capitalization of at least CDN$2.0 billion; and (2) a history of dividend growth or, in the Manager’s view, have a high potential for future dividend growth.
Brompton Funds Limited was founded in 2000. It is an experienced investment fund manager with income-focused investment solutions including TSX-traded closed-end funds and exchange-traded funds.
Dividend Growth Split Corp. has Class A shares and Preferred Shares listed on the TSX. Distributions to Class A shareholders are dependent on the Company having a Net Asset Value (“NAV”) per unit (each unit includes one Class A share and one Preferred share) of the Fund equal to or greater than $15 per unit.
In 2020, distributions to Class A shareholders were made in January and February only because, for all other months, the NAV per unit was less than $15 per unit. In 2019, four months reported a NAV per unit less than $15 per unit and, as a consequence, no distributions were made to Class A shareholders for those months.
COMMENT: Dividend Growth Split Corp. has an extraordinary dividend yield attributable to its Class A shares. However, if the Company is not able to generate a NAV of at least $15 per unit, the Company suspends its $0.10 per month dividend. Thus, in 2020 and 2021, with its NAV below $15 per unit, Class A unitholders did not receive any dividends for 9 months in 2020 and for 3 months in 2021. Suspension of monthly dividends can greatly impact dividend yields on an annual basis.
CHART 5: Dividend Growth Split Corp. One-Year Chart

Enbridge Inc. (TSX: ENB)
Enbridge Inc. (the “Company”) is a North American energy infrastructure company. The Company’s core businesses include (1) Liquids Pipelines, which transports approximately 25% of the crude oil produced in North America; (2) Gas Transmission and Midstream, which transports approximately 20% of the natural gas consumed in the USA; (3) Gas Distribution and Storage, which serves approximately 3.8 million retail customers in Ontario and Quebec; and (4) Renewable Power Generation, which generates approximately 1,763 MW of net renewable power in North America and Europe.
FIGURE 2: Enbridge 26-Year History of Dividend Growth
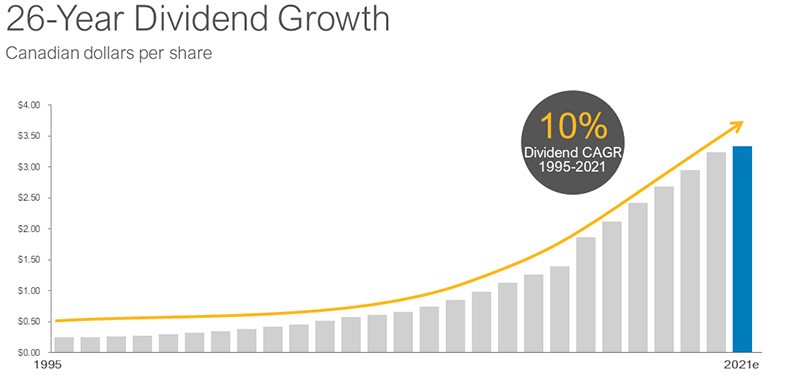
CHART 6: Enbridge One-Year Chart
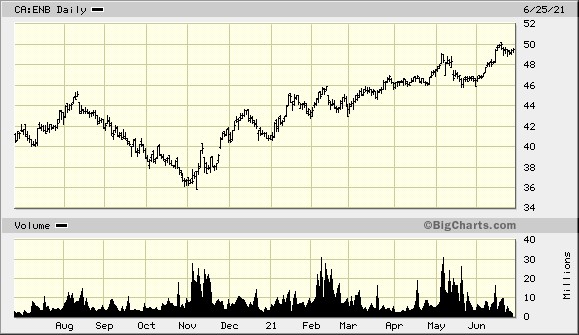
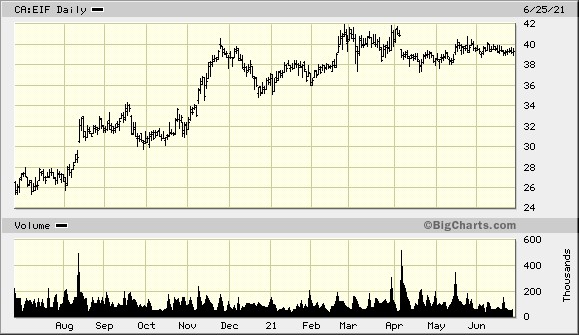
Exchange Income Corporation (TSX: EIF)
Exchange Income Corporation (the “Company”) is a diversified acquisition-oriented company, focused in two sectors: (1) aerospace & aviation services and equipment, and (2) manufacturing. The Corporation’s acquisition strategy is to identify already profitable, well-established companies that have strong management teams, generate steady cash flow, operate in niche markets, and have opportunities for organic growth. Its Aerospace and Aviation segment recognizes revenue on the provision of flight, flight ancillary services, and the sale or lease of aircraft and aftermarket parts. The Manufacturing segment recognizes revenue on the sales of manufacturing products and services. Geographically, it derives a majority of revenue from Canada and also has a presence in the United States; Europe, and other countries.
The Company’s dividend policy is to pay cash dividends in each monthly period based on funds generated and received from its subsidiaries. In determining the amount to send to the Company, the subsidiaries take into consideration their own requirements for maintenance and growth capital. The level of dividends is examined on an ongoing basis and, should the cash generated exceed the requirements for investment in maintenance and growth opportunities, the level of dividends will be reevaluated.
Year 2020 2019 2018 2017
Earnings Per Share $0.80 $2.58 $2.25 $2.23
Dividends Per Share $2.28 $2.2275 $2.175 $2.10
Coverage (times) 0.35x 1.16x 1.03x 1.06x
CHART 7: Exchange Income Corporation One-Year Chart
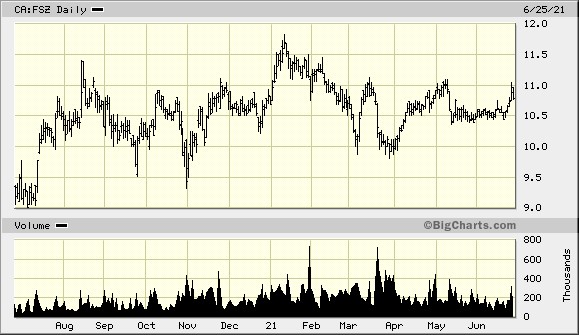
Fiera Capital Corporation (TSX: FSZ)
Fiera Capital Corporation (the “Company”) is an independent asset management firm with a growing global presence, and approximately C$173 billion in assets under management as of March 31, 2021. The Company delivers customized and multi-asset solutions across public and private market asset classes to institutional, financial intermediary, and private wealth clients across North America, Europe, and key markets in Asia. Fiera Capital is headquartered in Montreal, with its affiliates in various jurisdictions. The Company has offices in over a dozen cities around the world, including New York (U.S.), London (UK), and Hong Kong (SAR). In the USA, asset management services are provided by the Company’s affiliates who are investment advisers that are registered with the U.S. Securities and Exchange Commission (SEC) or exempt from registration.
FIGURE 3: Fiera’s Assets Under Management

CHART 7: Fiera Capital One-Year Chart
NorthWest Healthcare Properties REIT (TSX: NWH.UN)
NorthWest Healthcare Properties Real Estate Investment Trust (the “REIT”) operates a portfolio of high-quality healthcare real estate, comprised of interests in a diversified portfolio of 189 income-producing properties and 15.3 million square feet of gross leasable area, and located throughout major markets in the Americas, Europe, and Australasia. In Canada, the REIT is the largest non-government owner and manager of medical office buildings and healthcare facilities, including major concentrations in Calgary, Edmonton, Toronto, Montreal, Quebec City, and Halifax. In its international markets, the REIT is a partner with the region’s leading healthcare operators and has built comprehensive management platforms in global gateway cities comprised of quality healthcare real estate infrastructure assets with a capacity for future growth. The REIT’s portfolio of medical office buildings, clinics, and hospitals is characterized by long-term indexed leases and stable occupancies.
CHART 8: NorthWest Healthcare Properties REIT One-Year Chart

Slate Office REIT (TSX: NWH.UN)
Slate Office Real Estate Investment Trust (the “REIT”) is an owner and operator of North American office real estate. The REIT owns interests in and operates a portfolio of 34 strategic and well-located real estate assets across Canada’s major population centres, as well as two assets in downtown Chicago, Illinois. 60% of the REIT’s portfolio is comprised of government or credit-rated tenants. The REIT acquires quality assets at a discount to replacement cost and creates value by applying asset management strategies to grow rental revenue, extend lease terms, and increase occupancy.
CHART 9: Slate Office REIT One-Year Chart

TransAlta Renewables Inc. (TSX: RNW)
TransAlta Renewables Inc. (the “Company”) is a large renewable independent power producer (“IPP”) operating in Canada. The Company’s asset platform and economic interests are diversified in terms of geography, generation, and counterparties, and consist of interests in 24 wind facilities, 13 hydroelectric facilities, eight natural gas generation facilities, one solar facility, one natural gas pipeline, and one battery storage project, representing an ownership interest of 2,633 megawatts of owned generating capacity, located in parts of Canada, the USA, and Australia. The Company’s objectives are to: (1) provide stable, consistent investment returns through the ownership of, and investment in, highly-contracted renewable and natural gas power generation and other infrastructure assets that provide stable cash flow primarily through long-term contracts with strong counterparties; (2) pursue and capitalize on strategic growth opportunities in the renewable and natural gas power generation and other infrastructure sectors; (3) maintain diversity in terms of geography, generation and counterparties; and (4) payout 80% to 85% of cash available for distribution on an annual basis.
CHART 10: TransAlta Renewables One-Year Chart
Notes: All numbers in USD unless otherwise stated. The author of this report, and employees, consultants, and family of eResearch may own stock positions in companies mentioned in this article and may have been paid by a company mentioned in the article or research report. eResearch offers no representations or warranties that any of the information contained in this article is accurate or complete. Articles on eresearch.com are provided for general informational purposes only and do not constitute financial, investment, tax, legal, or accounting advice nor does it constitute an offer or solicitation to buy or sell any securities referred to. Individual circumstances and current events are critical to sound investment planning; anyone wishing to act on this information should consult with a financial advisor. The article may contain “forward-looking statements” within the meaning of applicable securities legislation. Forward-looking statements are based on the opinions and assumptions of the Company’s management as of the date made. They are inherently susceptible to uncertainty and other factors that could cause actual events/results to differ materially from these forward-looking statements. Additional risks and uncertainties, including those that the Company does not know about now or that it currently deems immaterial, may also adversely affect the Company’s business or any investment therein. Any projections given are principally intended for use as objectives and are not intended, and should not be taken, as assurances that the projected results will be obtained by the Company. The assumptions used may not prove to be accurate and a potential decline in the Company’s financial condition or results of operations may negatively impact the value of its securities. Please read eResearch’s full disclaimer.