eResearch | The market moved higher in the last two weeks of May as hopes for combatting COVID-19 gained traction. There is a race all around the world to come up with a viable vaccine. As the vaccine advances so, too, will the stock market, at least in the near-term. But as the effects of the wide-spread lock-downs begin to register in economic statistics, it is debatable whether the markets can “look over the valley” as the uncertainty of how long these effects will impact global economies in a negative way weighs on market sentiment. The markets may yet go back to test the March lows.
COVID-19 Kills the Bull Market
One thing for sure, COVID-19 has ended the longest bull market in U.S. history. From mid-February until mid-March, just 4 weeks of trading, the Dow Jones Industrial Average dropped 11,355 points, from 29,569 to 18,214, or 38.4%. The S&P/TSX Composite Index collapsed from 17,970 to 11,173, a total of 6,797 points, or 37.8%. The S&P 500 Index fell 1,202 points from 3,394 to 2,192, or 35.4%. Other global indexes recorded similar declines.
Such a quick and drastic decline lasted but one month. Then came a fairly sharp recovery, but it lasted for only six trading sessions. After a brief pull-back, the markets moved higher in early April for two weeks, then trended sideways until mid-May when it began to rise again.
At the end of May, the Dow Jones Industrial Average remains 14.2% below its all-time high, the S&P 500 Index is 10.3% below its all-time high, and the S&P/TSX Composite Index is 15.5% below its all-time high. It is difficult to foresee the indexes returning to their all-time highs any time soon, given the horrendous next few quarters of corporate earnings declines. Plus, most of the major economies of the world will have entered recession (two successive quarters of GDP decline) beginning with Q2/2020. GDP growth for the next few quarters is likely to be challenging, to say the least.
In fact, perhaps a greater fear is the possibility of a global depression (an annual decline in GDP exceeding 10%, such decline is calculated on a running twelve-month basis). That possibility has governments around the world scrambling to get their economies back to business.
In these negative environments, there will always be opportunities for the astute investor, and using seasonality trends can be a useful investing tool.
Seasonal Positive Strength for the Market Segments in June
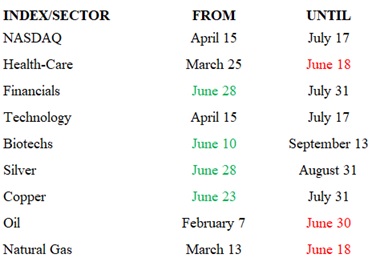
The following table shows which indexes and sectors are “in season” during the month of June. The dates in GREEN under FROM are this month’s additions, and the three in RED under UNTIL are this month’s expiries.
(A full list of indexes and sectors is provided at the end of this report.)
The four sectors added to the seasonality mix in June are Financials, Biotechs, Silver, and Copper. The three sectors which reach the end of their seasonal strength in June are Health-Care, Oil, and Natural Gas.
TABLE 1: Current Seasonal Positive Strength for the Market Segments
Importance of Seasonality Trends
Utilizing the market’s historical seasonality trends can provide a useful framework for assessing and then altering the mix of one’s stock portfolio. Highly volatile markets often open up exceptional opportunities for astute investors to take advantage of market weakness to buy quality stocks that have declined in price significantly in line with the overall market downdraft. As a result, market sectors that are “in season” often provide exceptional stock-buying opportunities in such dire market conditions.
Seasonality refers to particular time-frames when stocks/sectors/indexes are subjected to and influenced by recurring tendencies that produce patterns that are apparent in the investment valuation process. A seasonality study preferably uses at least 10 years of data. Our data is for 14 years.
Seasonality Trends Chart
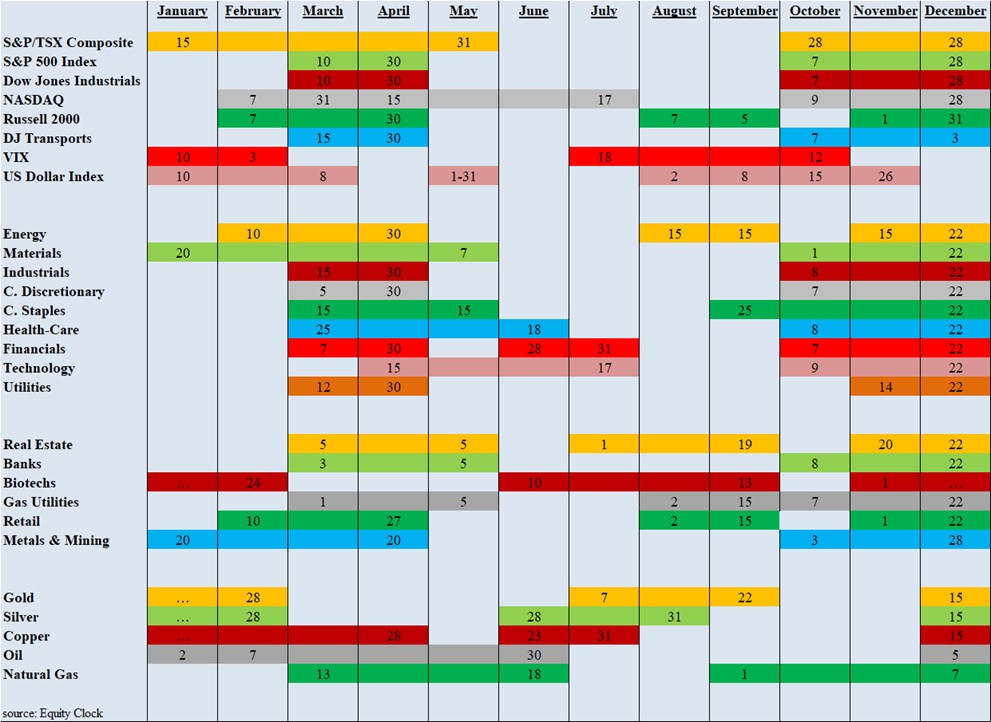
The Seasonality trends chart is an ever-changing 14-year average of the indexes and sub-indexes that we track. The charts are courtesy of www.equityclock.com.
The Seasonality Trends chart below has been updated as of May 2020. It shows the periods of seasonal strength for 28 market segments (sectors/indexes). Each bar indicates a buy and a sell date based upon the optimal holding period for each market sector/index.
TABLE 2: Seasonality Trends Chart
//
