eResearch | The COVID-19 pandemic has increased demand and user activity for various stay-at-home companies focused on businesses that cater to consumers isolated due to lockdowns. Stay-at-home products and services include connected home fitness equipment, streaming platforms, online marketplaces, and social media platforms.
Last week, stay-at-home companies reported Q1/2020 earnings, including Shopify Inc. (TSX: SHOP), Netflix Inc. (NASDAQ: NFLX), Roku Inc. (NASDAQ: ROKU), Peloton Interactive Inc. (NASDAQ: PTON), Etsy Inc. (NASDAQ: ETSY), and Pinterest Inc. (NYSE: PINS).
See below further details on the stay-at-home companies’ most recent earnings report.
Shopify
![]()
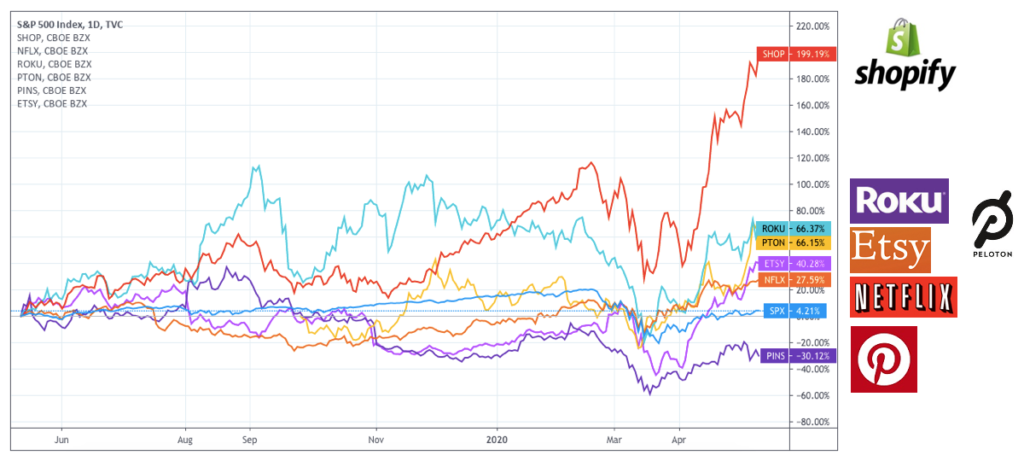
![]() This past year, Shopify’s stock price has increased by 199% to C$1051.74 per share, reaching a market capitalization of C$122 billion and battling Royal Bank of Canada (TSX: RY) for the title of Canada’s most valuable publicly-listed company.
This past year, Shopify’s stock price has increased by 199% to C$1051.74 per share, reaching a market capitalization of C$122 billion and battling Royal Bank of Canada (TSX: RY) for the title of Canada’s most valuable publicly-listed company.
As the pandemic forced most retail operations online, Shopify became an essential platform to support businesses of all sizes with an affordable and easy to set-up online option for point of sales.
Shopify stated in its recent earnings report that in-store transactions dropped 71% due to the lockdowns, but the loss of revenues was offset by 94% from its merchants who experienced a significant increase in online sales.
In light of the crisis, Shopify increased its allowance for doubtful accounts and opened up its Shopify Capital lending program to merchants in Canada and the United Kingdoms, with an additional US$200 million in funding. Shopify also developed new software features to allow merchants to offer curb-side pickup for online orders.
Q1/2020 Shopify Financial Highlights
- Revenue of US$470 million, a 47% increase year-over-year, consisting of US$282 million from Merchant solutions and US$188 million from Subscription solutions.
- Cost of revenues of US$213million, a 52% increase year-over-year, mainly due to costs from Merchant solutions increasing by 56% to US$175 million.
- Operating expenses of US$330 million, a 53% increase year-over-year, due to a 47% increase in marketing costs to US$155 million, a 52% increase in R&D costs to US$116 million, a 48% increase in SG&A costs to US$44.8 million, and a 220% increase in transaction and loan losses to US$14 million.
- Net losses of US$31 million, a 30% increase year-over-year, due to higher spending in marketing and R&D.
- Cash, Cash Equivalents, and Marketable Securities of US$2.4 billion, Current Liabilities of US$288 million, and Long-term Liabilities of US$142 million.
Netflix
![]()
![]() This past year, Netflix’s stock price has increased by 28% to US$440.52 per share, reaching a market capitalization of US$194 billion.
This past year, Netflix’s stock price has increased by 28% to US$440.52 per share, reaching a market capitalization of US$194 billion.
As consumers stay confined at home, in Q1/2020, Netflix reported 15.8 million net membership additions, a 64% increase quarter-over-quarter. However, revenue was in-line with guidance due to the U.S. dollar appreciating against other currencies.
Filming of new content is currently put on hold due to the COVID-19 pandemic, but Netflix has over 200 projects in post-production, operating remotely. As production of new content slows down, Netflix expects higher free cash flows in the short term.
In March, Netflix created a US$100 million fund to support its production teams affected by the pandemic and donated US$30 million to provide emergency relief for out-of-work crew members in the film industry across various countries where it has a large production base.
Q1/2020 Netflix Financial Highlights
- Revenue of US$5.8 billion, a 28% increase year-over-year, due to 15.8 million net membership.
- Cost of revenues of US$3.6 billion, a 25% increase year-over-year, mainly due to amortization costs of content assets.
- Operating Expenses of US$1.2 billion, a 1.5% increase year-over-year, due to a 22% increase in R&D costs to US$454 million and a 25% increase in SG&A costs to US$252 million, offset by an 18% decrease in Marketing Costs to US$504 million.
- Net income of US$709 million, a 106% increase year-over-year, due to increased net membership additions and reduced spending on new content development.
- Cash, Cash Equivalents, and other Current Assets of US$6.4 billion, Current Liabilities of US$7.9 billion, and Long-term Liabilities of US$14 billion.
Roku
 This past year, Roku’s stock price has increased by 60% to US$132.18 per share, reaching a market capitalization of US$15.9 billion.
Roku initially saw clients who were affected by the COVID-19 pandemic pull advertisement campaigns, but the decrease in revenues was offset by an increase in other companies shifting advertisement platforms from traditional television to Roku.
The stay-at-home orders also gave Roku a spike in account activations and streaming hours, and in Q1/2020, Roku added 2.9 million new accounts, increased platform streaming hours by 49%, and increased average revenue per customer by 28%.
To reduce risks during these times of economic uncertainty, Roku preemptively drew down US$69 million from its revolving credit facility, in addition to slowing down operating expenses and capital expenditures.
Q1/2020 Roku Financial Highlights
- Revenue of US$321 million, a 55% increase year-over-year, due to a 73% increase in Platform Subscriptions to US$233 million and a 22% increase in Player Sales to US$88 million.
- Cost of Revenues of US$180 million, an 70% increase year-over-year, attributed to a 39% increase in Platform Costs to US$131 million and a 48% increase in Player Costs to US$10 million.
- Operating Expenses of US$196 million, a 76% increase year-over-year, due to a 58% increase in R&D costs to US$88 million, a 102% increase in Marketing Costs to US$68 million, and an 80% increase in SG&A costs to US$40 million.
- Net Losses of US$55 million, a 461% increase year-over-year, due to significant spending in Marketing and R&D.
- Cash and Cash Equivalents of US$588 million, Current Liabilities of US$372 million, and Long-term Liabilities of US$494 million.
Further details on Netflix and Roku’s 2019 financial performance can be seen in an article posted on March 29, 2020 –“Netflix, Disney, Roku and Other Streaming Platforms Hogging All the Bandwidth”
Peloton
 This past year, Peloton’s stock price has increased by 70% to US$42.80 per share, reaching a market capitalization of US$12 billion.
Due to the pandemic, Peloton was forced to close all 97 retail showrooms where it sold its connected fitness bikes, and cease productions of any new fitness programs.
As commercial gyms also closed due to being categorized as non-essential, Peloton experienced a spike in demand with a 92% increase in bike product sales and a 54% increase in fitness program subscription sales.
Peloton also reported an impressive churn rate of 0.46%, which signifies that less than one percent of consumers ceased subscriptions for its interconnected cycling classes.
Nevertheless, Peloton is continuing to record bottom line losses due to high marketing costs, but it plans to reduce spending significantly, and instead, rely on word-of-mouth marketing from its current members.
As demand surges for the connected fitness bikes, Peloton is struggling to meet the unexpected backlog of orders and expects deliveries to be pushed till next quarter.
Q1/2020 Peloton Financial Highlights
- Revenue of US$525 million, a 66% increase year-over-year, mainly due to a 61% increase in Connected Fitness Bike sales to US$420 million and a 91% increase in Subscription Sales to US$98 million.
- Cost of Revenues of US$279 million, a 42% increase year-over-year, attributed to a 51% increase in Connected Fitness Bike costs to US$230 million and an 89% increase in Subscription Costs to US$42 million.
- Operating Expenses of US$304 million, an 88% increase year-over-year, due to a 53% increase in Marketing Costs to US$155 million, a 170% increase in SG&A costs to US$127 million, and a 63% increase in R&D costs to US$23 million.
- Net Losses of US$56 million, a 44% increase year-over-year, due to significant investments in Marketing and R&D.
- Cash, Cash equivalents, and Marketable Securities of US$1.4 billion, Current Liabilities of US$540 million, and Long-term Liabilities of US$513 million.
Etsy
 This past year, Etsy’s stock price has increased by 40% to US$80.28 per share, reaching a market capitalization of US$9.5 billion.
Etsy experienced a 100% year-over-year growth in gross merchandise sales to US$1.4 billion on its online marketplace due to the pandemic closing physical shops of retail competitors and delaying supply chains of online competitors.
As consumers stay at home, Etsy saw an increase in sales for product categories including home and living, craft supplies, self-care, toys and games, and gifts.
Due to the COVID-19 virus stimulating a high demand for personal protective equipment, Etsy generated US$133 million or 17% of total sales from fabric face mask sales.
As millions of new customers join the marketplace, Etsy is currently focusing on customer relationship management strategies and various marketing campaigns to develop customer loyalty.
Q1/2020 Etsy Financial Highlights
- Revenue of US$228 million, a 35% increase year-over-year, due to a 23% increase in Marketplace Sales to US$156 million and a 71% increase in Services Sales to US$72 million.
- Cost of Revenues of US$82 million, a 57% increase year-over-year, attributed to costs related to the Google Shopping portion of the new Etsy Ads platform and amortization costs for developed technologies.
- Operating Expenses of US$121 million, a 41% increase year-over-year, due to a 37% increase in Marketing Costs to US$49 million, a 52% increase in Product Development Costs to US$38 million, and 38% increase in SG&A costs to US$34 million.
- Net Income of US$13 million, a 60% decrease year-over-year, due to increased investments for Product Development and higher spending for Marketing.
- Cash, Cash Equivalents, and Short-term Investments of US$804 million, Current Liabilities of US$159 million, and Long-term Liabilities of US$952 million.
![]()
![]() This past year, Pinterest’s stock price has decreased by 30% to US$18.61 per share, reaching a market capitalization of US$11 billion.
This past year, Pinterest’s stock price has decreased by 30% to US$18.61 per share, reaching a market capitalization of US$11 billion.
The closing of retail stores around the world due to the COVID-19 pandemic significantly decreased the volume of advertisements on Pinterest’s picture-sharing social media platform.
In Q1/2020, Pinterest experienced a 26% increase in monthly active users, year-over-year, but the annual growth rate remained stagnant. In addition, Pinterest expanded net losses by 241% as it significantly increased spending in marketing and R&D expenses.
However, as more people stay at home, Pinterest reported a significant increase in engagement from users with almost 50% coming from new users.
Q1/2020 Pinterest Financial Highlights
- Revenues of US$272 million, a 35% increase year-over-year, due to global monthly active users growth of 26% to 367 million users.
- Cost of Revenues of US$99 million, a 35% increase year-over-year,
- Operating Expenses of US$319 million, an 84% increase year-over-year, due to a 101% increase in R&D costs to US$146 million, a 53% increase in Marketing Costs to US$117 million, and a 132% increase in SG&A Costs to US$56 million.
- Net Losses of US$141 million, a 241% increase year-over-year, due to significant investments in Marketing and R&D Expenses.
- Cash, Cash Equivalents, and Marketable Securities of US$1.7 billion, Current Liabilities of US$171 million, and Long-term Liabilities of US$179 million.
//
GRAPH 1: Comparison of Stay-at-Home Companies vs S&P 500 (1 Year)