eResearch Corporation is pleased to provide a summary of CNN Money’s Fear & Greed index.
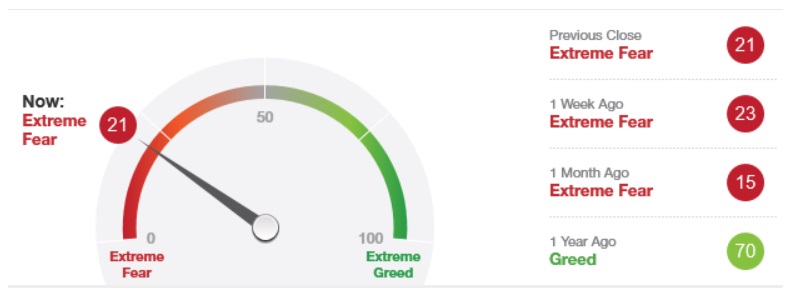
The current Fear & Greed index is 21 indicating “Extreme Fear”.
CNN Money creates a Fear & Greed index by looking at seven market indicators:
- Junk Bond Demand: The spread between yields on investment grade bonds and junk bonds. The higher the spread, the more risk adverse investors are.
- Put and Call Options: The put/call ratio, which compares the trading volume of bullish call options relative to the trading volume of bearish put options.
- Market Momentum: The S&P 500 (SPX) versus its 125-day moving average
- Market Volatility: The CBOE Volatility Index (VIX) measures volatility over the next 30 days.
- Safe Haven Demand: The difference in 20-day stock and Treasury returns.
- Stock Price Breadth: The volume of shares trading in stocks on the rise versus those declining using the McClellan Volume Summation Index.
- Stock Price Strength: The number of stocks hitting 52-week highs and lows on the New York Stock Exchange.
For the week ending April 3 at 5:10pm, here are the results:
| INDICATOR | RATING |
| Junk Bond Demand | Extreme Fear |
| Put and Call Options | Greed |
| Market Momentum | Extreme Fear |
| Market Volatility | Fear |
| Safe Haven Demand | Extreme Fear |
| Stock Price Breadth | Extreme Fear |
| Stock Price Strength | Extreme Fear |
| RESULT: 21 | Extreme Fear |
DIAGRAM 1: Fear & Greed Index Meter
The rationale for the index is that investors are driven by two main emotions: Fear and Greed.
- When too much Fear rules the market – stock prices might drop below their intrinsic value.
- When too much Greed rules the market – stock prices might be bid up, above their intrinsic value.
Each market indicator is rated on a scale from 0 to 100, the higher the reading, the greedier investors are being; 50 is neutral. All of the Indicators are summed, equally weighted, for a final index reading.
Key:
Status Reading
Extreme Fear 0-25
Fear 26-44
Neutral 45-55
Greed 56-74
Extreme Greed 75-100
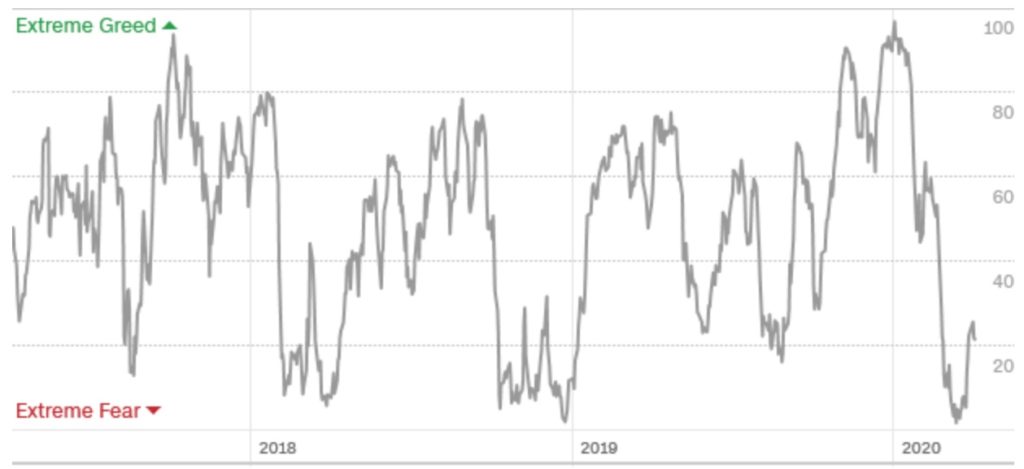
DIAGRAM 2: Fear & Greed Index Three-year Graph
LINK TO ORIGINAL ARTICLE
You can visit CNN Money’s Fear & Greed index by clicking here: money.cnn.com/data/fear-and-greed/
NOTE: The above link is “live” and the readings will change during each trading day. The readings are “static” from about 5:00 pm until the next market opening day.
//