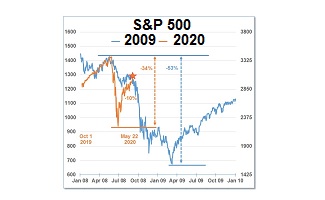
eResearch | Today’s article from Chris Kimble looks at the possibility of the nine-year bull market coming to an end. This possibility has been exacerbated by the sharp decline in the market indexes a week ago. Although a good recovery was staged at the beginning of the current week, the indexes now look like they are going to go back and test their recent lows.
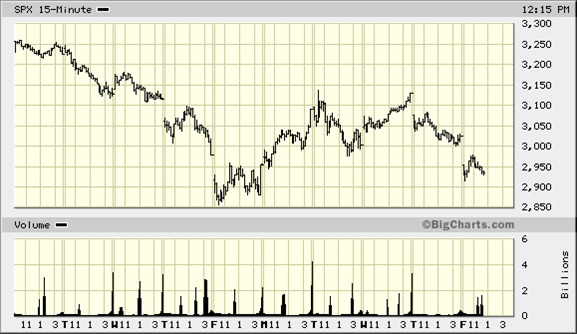
Last week, the S&P 500 dropped about 12%.
Chart 1: S&P 500 Chart (2-Week ) 15-Minute Intervals
The DJIA fell an equal 12%.
Chart 2: DJIA Chart (2-Week ) 15-Minute Intervals
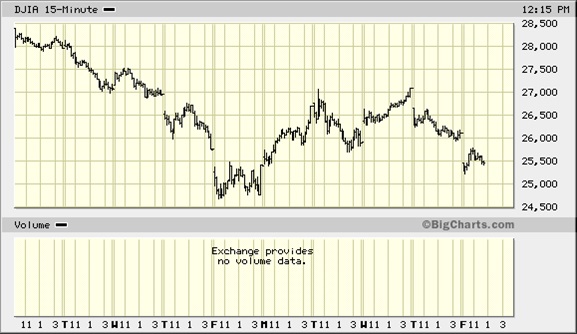
These are the fastest +10% declines in their respective histories.
However, did these declines break below their long-term rising channels? Check out the chart triage below. From left to right, these charts are for the Banks Index (BKX), JPMorgan (JPM), and the S&P 500 Index (SPX).
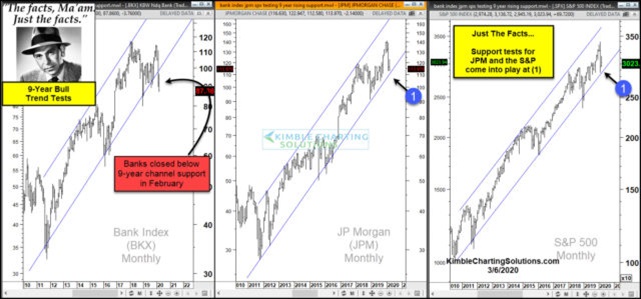
Each of these indexes has spent most of the past nine years within their respective rising channels, creating higher lows and higher highs.
The Bank Index closed below its lower channel line in February.
JPM and the S&P 500 both remain within their respective channels, but are testing support at each (1). For now, their respective long-term bull-trend still exists.
Kimble concludes as follows: If the S&P and JPM close on a monthly basis below 9-year rising channels at each (1), the 9-year bull market/trend looks to be in jeopardy.
To read Chris Kimble’s article, click here: Bull Market In Jeopardy
//