eResearch | Market-based indicators are important because they can be viewed in real-time, and they reflect how the market interprets and assimilates all current information.
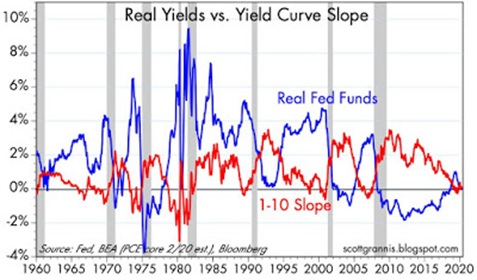
Real Yields Versus Slope of Yield Curve
The chart below compares the level of the real Fed funds rate (blue line) with the slope of the Treasury yield curve from 1 to 10 years. Every recession on this chart (shown by the shaded vertical lines) has been preceded by a substantial rise in the real funds rate (and, thus, a substantial increase in real borrowing costs) and a flat or negatively-sloped yield curve. Currently, those conditions are not present.
TIPS Compared to Treasury Real Yields and Overnight Risk-Free Real Yields
The Author provides two charts (not shown here) comparing Treasury Inflation-Protected Securities to Treasury Real Yields and to Overnight Risk-Free Real Yields. The conclusions from both of these charts are that the Fed is highly unlikely to tighten and will keep policy on track and, thus, pose no real threat to the economy.
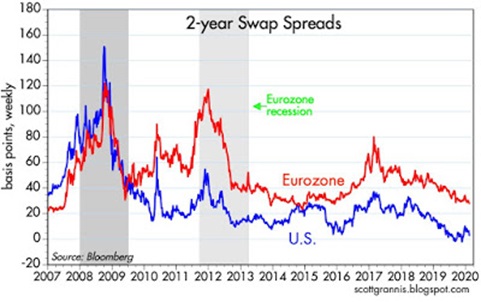
Swap Spreads
One of Mr. Grannis’ favourite charts is the 2-year Swaps Spread, which he uses to measure systemic risk, financial market liquidity, and fundamental economic health. The lower the Spread the better and, as the following chart shows, the Spreads are low for both the USA and the EuroZone. This indicates that liquidity in both key markets is abundant and, as such, central bank monetary policy is non-threatening. This further suggests that the outlook for the global economy is healthy.
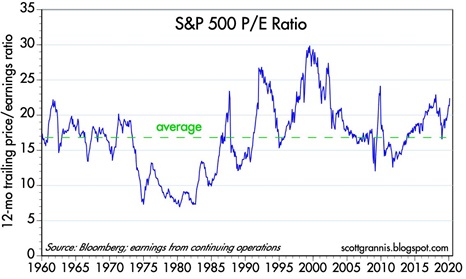
S&P 500 P/E Ratios
The next chart shows the adjusted P/E ratio for the S&P 500. Although P/E ratios are currently above the average of about 16, they are still well below the extremes they reached in the early 1990s and again in the early 2000s. There is certainly no “bubble” present at the current time.
These are only a few of the market-indicator charts that Scott Grannis presents in his latest article. You can read the entire Calafia Beach Pundit article with its accompanying 13 charts by clicking: Updated Key Market-Based Indicators
//