eResearch | January historically is a good month for stocks and this year was no exception … until the last week. Then the wheels came off due to a combination of factors, most notably the coronavirus epidemic. In U.S. markets, the week (and month) ended with DJIA down 1.0% while the S&P 500 dropped 0.2%. and the Nasdaq was up 2.0%. In Canada, the S&P/TSX Composite Index was ahead by 1.5%. February is also traditionally a good month for positive stock performance. In this respect, knowing what market sectors usually show market strength at this time of year can provide a real advantage.
Changes for February
February has 6 additions to the seasonality mix while, over the ensuing four weeks, there are 3 sub-indexes, Bio-Tech, Gold, and Silver, that reach the end of their seasonality strength. See the chart below.
Seasonal Positive Strength for the Market Segments in February
The following table shows which indexes and sectors are “in season” during the month of February. The dates in GREEN under FROM are this month’s additions, and the ones in RED under UNTIL are expiries.
Current Seasonal Positive Strength for the Market Segments
INDEX/SECTOR | FROM | UNTIL |
| S&P/TSX Composite | October 28 | June 5 |
| S&P 500 Index | October 28 | May 5 |
| Dow Jones Industrials | October 28 | May 17 |
| Russell 2000 | February 1 | April 30 |
| DJ Transports | February 3 | April 16 |
| U.S. Dollar | January 1 | March 8 |
| Energy | February 1 | April 30 |
| Consumer Discretionary | February 10 | April 30 |
| Materials | January 20 | May 5 |
| Real Estate | January 20 | May 5 |
| Banks | February 21 | April 30 |
| Bio-Techs | October 28 | February 24 |
| Retail | January 18 | April 27 |
| Metals & Mining | January 20 | May 5 |
| Gold | December 15 | February 28 |
| Silver | December 15 | February 28 |
| Copper | December 15 | April 28 |
| Oil | February 7 | September 22 |
Source: Equity Clock and eResearch
Importance of Seasonality Trends
Seasonality refers to particular time-frames when stocks/sectors/indexes are subjected to and influenced by recurring tendencies that produce patterns that are apparent in the investment valuation process. A seasonality study preferably uses at least 10 years of data.
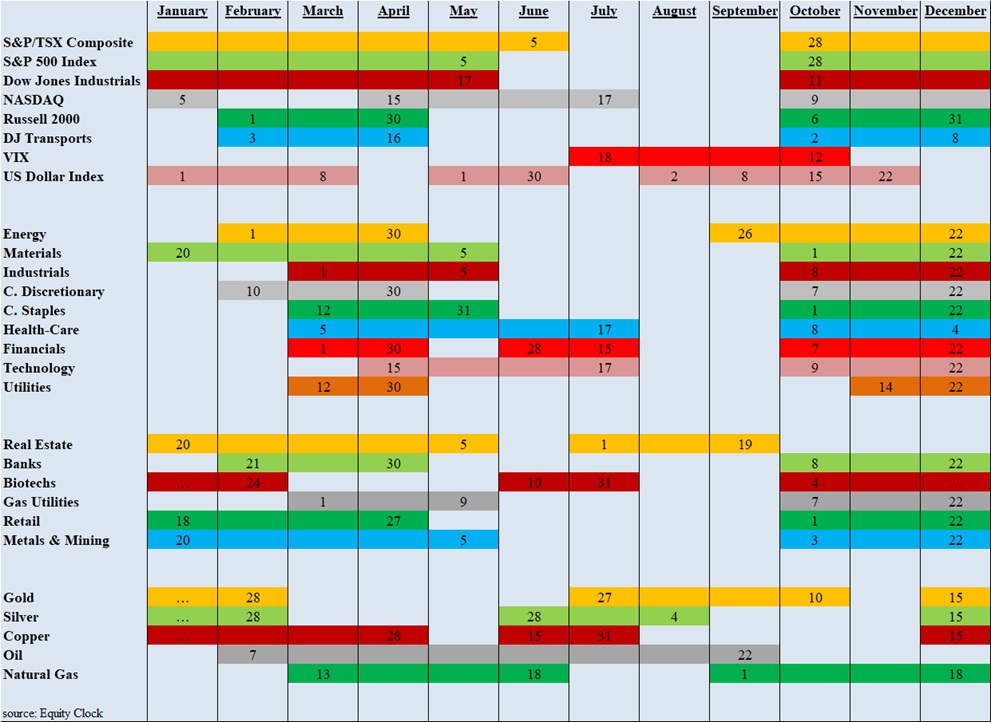
Seasonality Trends Chart
The Seasonality Trends chart below shows the periods of seasonal strength for 28 market segments (sectors/indexes). Each bar indicates a buy and a sell date based upon the optimal holding period for each market sector/index.
 //
//
