eResearch | The Dividend-Income Portfolio has performed well so far in 2020 amidst the turmoil surrounding an integral assassination, the ballistic missile response, and an unfortunate downing of a commercial aircraft.
The Portfolio
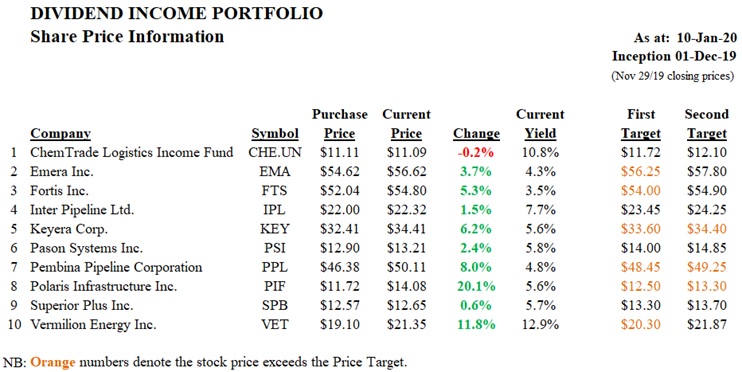
The 10 stocks that comprise the Portfolio are shown below. There have been no changes since inception on December 1 last year. Quite a few of the stocks have exceeded both of their Target Prices.
Comparables
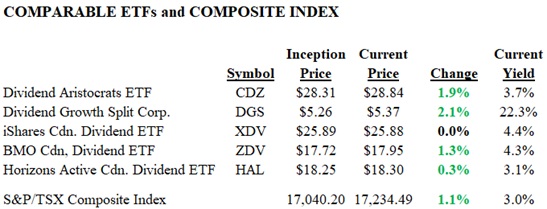
We have included 5 ETFs as comparables (which also are actively traded and, so, could have been included in the Portfolio) and the S&P/TSX Composite Index to serve as benchmarks for our Portfolio’s performance. These are as follows.
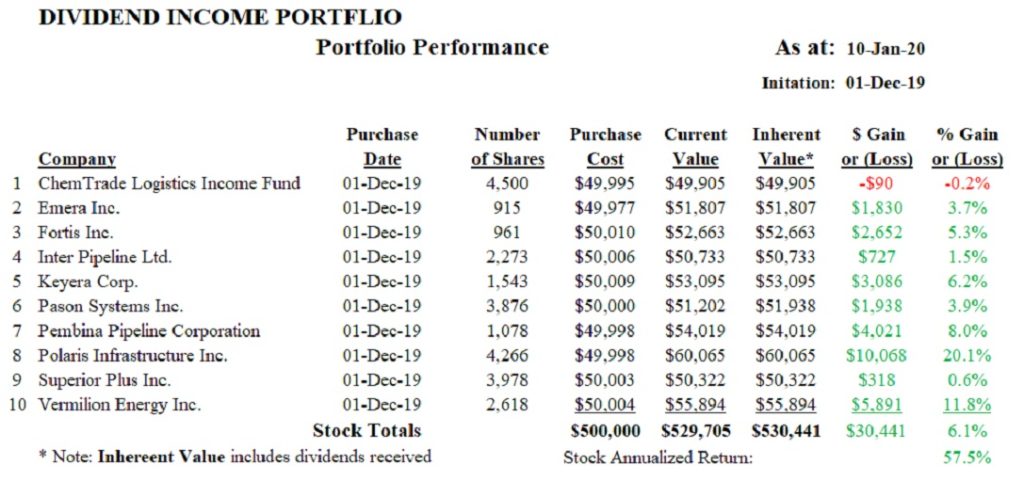
Portfolio Performance
The next table shows the Portfolio’s performance to date.
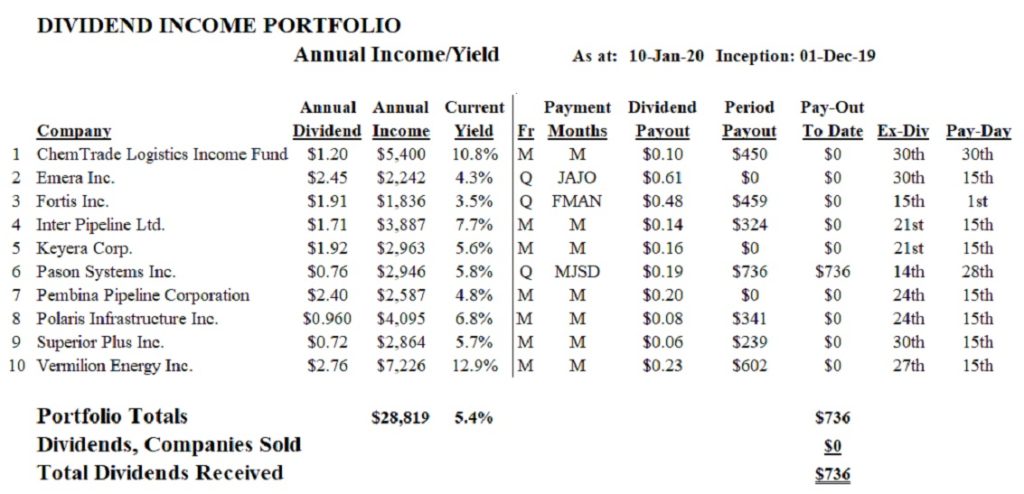
Dividends and Yields
The table set out below shows relevant information regarding annual dividend amounts, associated yields, ex-dividend dates and payment dates for the stocks in the Portfolio as well as for the ETF comparables.
You can read our entire report here: Dividend-Income Portfolio January 10, 2020
//