eResearch│ We have created a portfolio of high-payout common stocks that is focused primarily on attractive dividend yields but with some capital growth potential.
NOTE: The Top-Ten Dividend Yield Portfolio is designed with a longer-term perspective. As such, henceforth, we will update it every month, using Friday’s closing prices. Essentially, it will be a Buy-and-Hold portfolio, with minimal trading involved. The Portfolio will be appropriately invested but, if circumstances warrant, there could be a sizable cash component. The Portfolio was initiated on June 1, 2021, with a full complement of ten stocks. The initial investment, at inception, was $500,000.
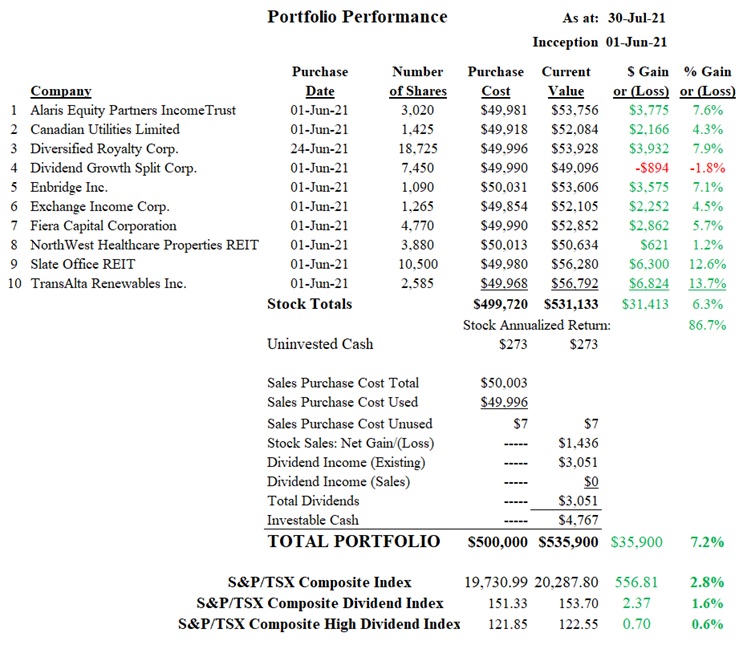
TODAY’S COMMENT: The value of the Portfolio on July 30 was $535,900, up 7.2% from the $500,000 initial investment. For comparative purposes, the S&P/TSX Composite Index gained 2.8% since inception.
The portfolio is presented below.
FIGURE 1: Top Ten Yield Portfolio
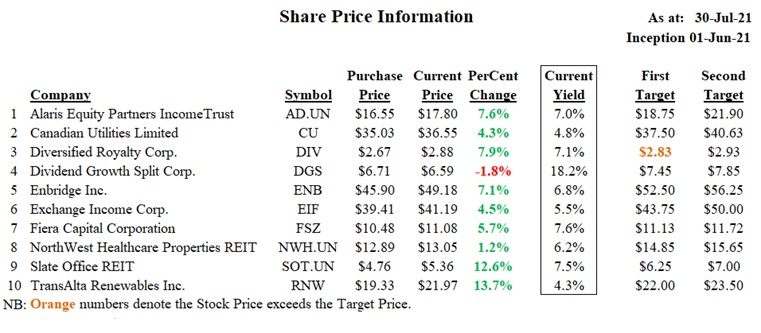
COMMENT: In the Portfolio, there is only one stock, Dividend Growth Split Corp., which is in the RED, and by only 1.8%. And, one stock, Diversified Royalty Corp., which was only added to the Portfolio on June 24, has achieved its First Target Price. The top performers are TransAlta Renewables, up 13.7%, and Slate Office REIT, up 12.6%.
The Portfolio’s performance is provided in the following table.
FIGURE 2: Top Ten Yield Portfolio – Performance
COMPARABLES
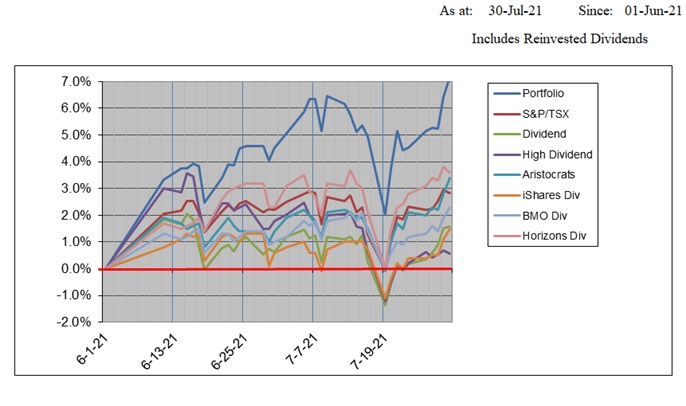
In the next table below, we compare the performance of the Portfolio against selected higher-yield ETFs as well as the S&P/TSX Composite Index. We also include the S&P/TSX Composite Dividend Index and the S&P/TSX Composite High Dividend Index. We also show the performance of the respective ETFs and Indexes in graphical form.
Since the Portfolio’s inception on June 1, 2021, the Portfolio is up 7.2%, while the comparables range between 0.8% and 2.9%. The S&P/TSX Composite Index is ahead by 2.8%.
FIGURE 3: Comparable ETFs and Composite Indexes
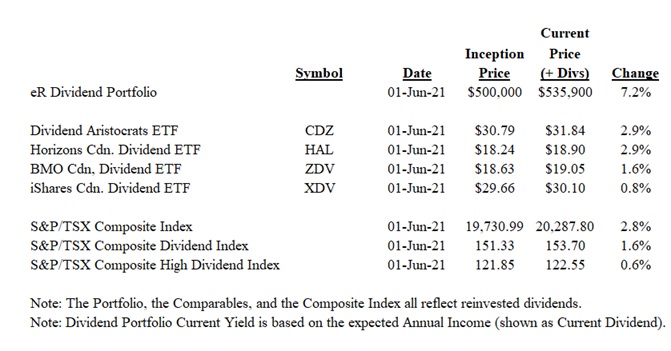
FIGURE 4: Comparable ETFs and Composite Indexes – Graphical Comparison
DIVIDEND INCOME/YIELD
Below, we provide a table that indicates the annual dividend, the corresponding annual income and current equity yields, and the dividend pay-outs to date since inception.
The Portfolio is currently yielding 7.3%.
FIGURE 5: Top Ten Portfolio – Annual Income/Yield
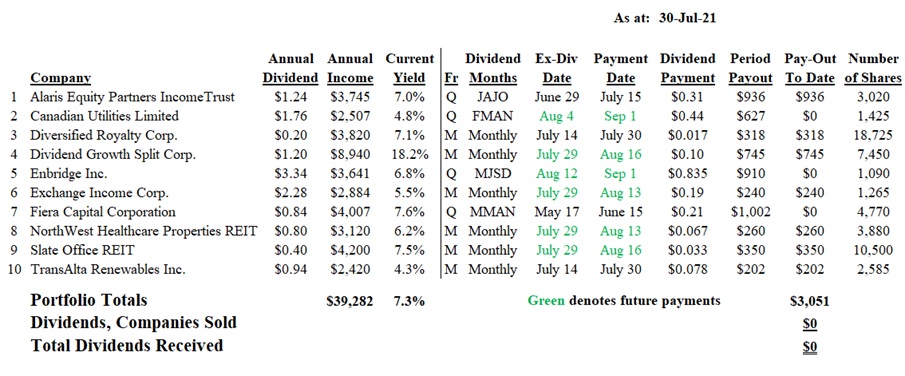
FIGURE 6: Stocks Sold

Notes: All numbers in CAD unless otherwise stated. The author of this report, and employees, consultants, and family of eResearch may own stock positions in companies mentioned in this article and may have been paid by a company mentioned in the article or research report. eResearch offers no representations or warranties that any of the information contained in this article is accurate or complete. Articles on eresearch.com are provided for general informational purposes only and do not constitute financial, investment, tax, legal, or accounting advice nor does it constitute an offer or solicitation to buy or sell any securities referred to. Individual circumstances and current events are critical to sound investment planning; anyone wishing to act on this information should consult with a financial advisor. The article may contain “forward-looking statements” within the meaning of applicable securities legislation. Forward-looking statements are based on the opinions and assumptions of the Company’s management as of the date made. They are inherently susceptible to uncertainty and other factors that could cause actual events/results to differ materially from these forward-looking statements. Additional risks and uncertainties, including those that the Company does not know about now or that it currently deems immaterial, may also adversely affect the Company’s business or any investment therein. Any projections given are principally intended for use as objectives and are not intended, and should not be taken, as assurances that the projected results will be obtained by the Company. The assumptions used may not prove to be accurate and a potential decline in the Company’s financial condition or results of operations may negatively impact the value of its securities. Please read eResearch’s full disclaimer.