eResearch | Having broken through the Triple Top formation around 800, RASI now stands at 883 with the next resistance level 22% higher at 1074. However, the very recent military escalation in the Middle East, if it gets out of hand, could cause a market swoon. As always, these are volatile times and investors need to be nimble in their decision-making regarding their investment strategies.
Index Reading At Friday December 31 Year-End Close
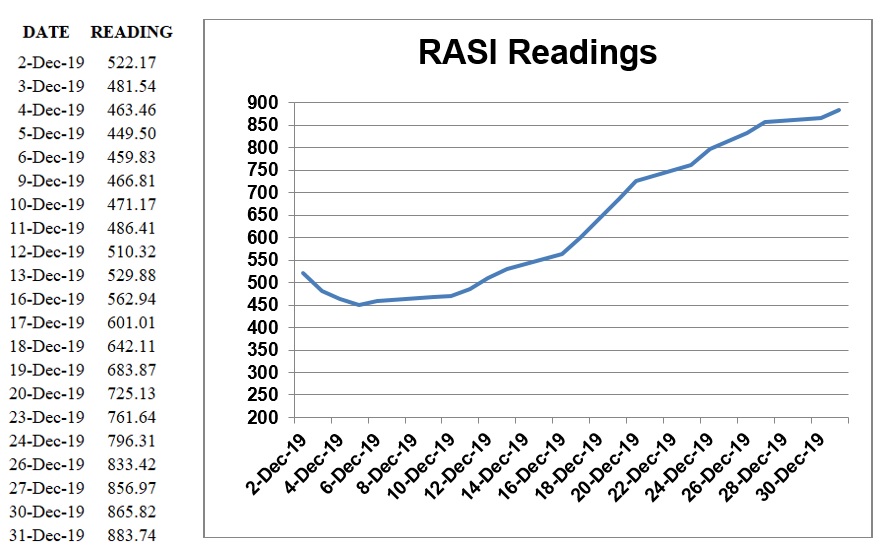
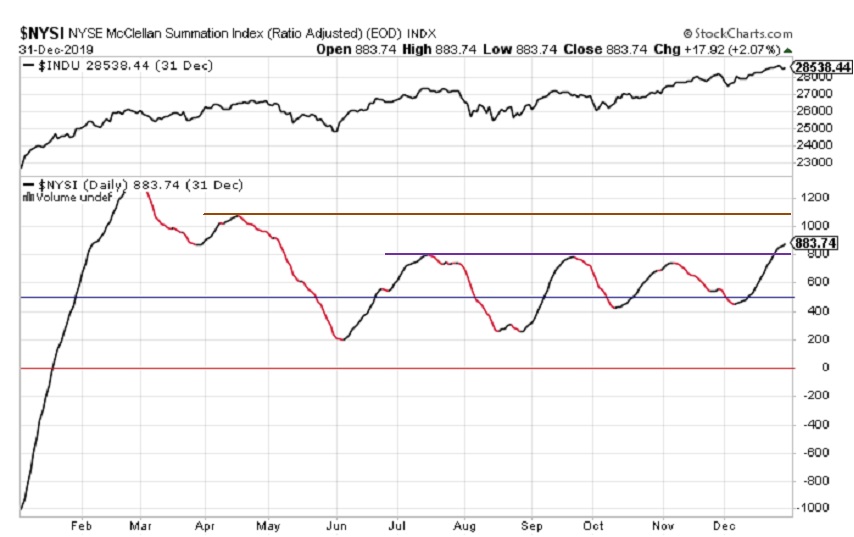
The RASI at the close of the last day of trading in 2019, on Tuesday, December 31, stood at 883. The Index fell below the 500 benchmark that denotes a “Positive” market outlook relative to a “Negative” one on December 3 and reached its near-term nadir on December 5. It followed with an abrupt turn-around and has headed higher every day since then.
December Readings and Chart
One-Year Chart
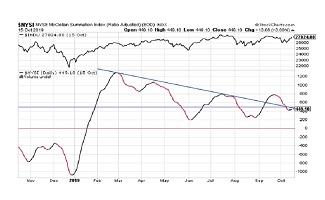
The following chart shows the RASI for the year 2019. It reached a high of 1288 on February 27 and hit a low of 203 on June 5.
In previous reports, we commented that the 800 mark (Purple line) represented a possible Triple Top and that it was imperative that the RASI break through that resistance line with conviction. Well, it certainly did that.
The next level of resistance is not until the intermediate high in mid-April of 1074, as denoted by the Brown line. That is 22% above the current reading, so lots of possible upside remains. Of course, for whatever reason(s), the Index could turn lower before reaching that intermediate high.
Conclusion
RASI continues ever higher with no retrenchment in the last three weeks and none on the horizon. However, current sabre-rattling in the Middle East could easily escalate, causing market anxiety, and putting an end to the RASI rally.
Significance of RASI Index for the Market
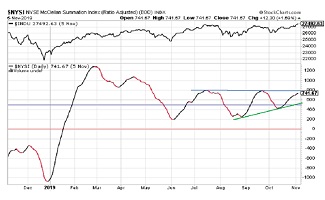
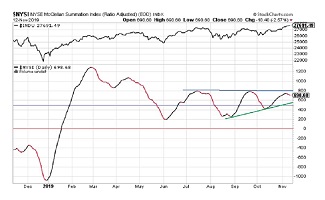
The RASI Index has proven to be a good predictor of the future direction of the DJIA. The upper section of the chart above depicts the closing prices of the DJIA and, clearly, there is a good correlation between the two indexes. Since the lows of mid to late August, the RASI and the DJIA both moved higher in unison and, from mid-September until almost mid-October, they both moved lower together. At that point, they both moved higher together until the beginning of November, and then the two indexes diverged for most of that month. At the very end of November, the two indexes moved back in sync as each of them exhibited a strong upwards move that is continuing.
//
What is the Ratio-Adjusted Summation Index (RASI)?
- The Ratio-Adjusted Summation Index, RASI, is a market indicator developed by Tom McClellan of McClellan Financial Publications.
- A RASI reading that rises to and reaches a specified level (500 and above) can be a signal that a new market up-trend is starting.
- The +500 level is an important dividing line for the RASI, in terms of giving a go/no-go signal about the new up-trend.
- When a rebound in the RASI occurs, but it falls short of getting up to the 500 level, historically that has meant trouble lies ahead.
- But zooming well above 500 is a sign that there is a lot of strength behind the move, and the higher it goes above 500, the more emphatic the message of strength.
- Conversely, a move from well above 500 down to and below 500 is a signal that the market is weakening and that it should move lower.
//