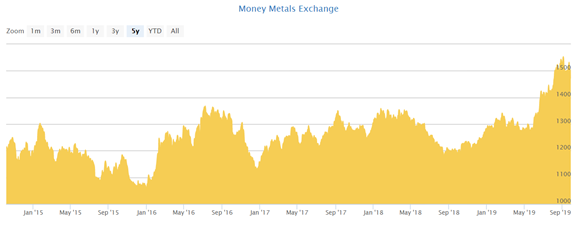
eResearch | Chart 1 shows the trend in the price of gold over the past five years. Not much happened until recently.
Chart 1: Five-Year Gold Chart
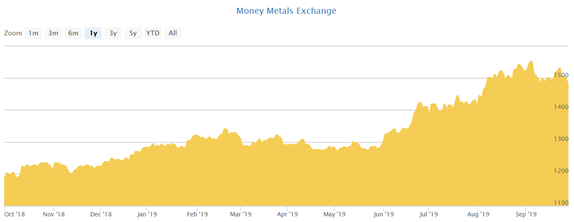
Gold has had a great run lately, shown in Chart 2. Since late August 2018, the price of gold has risen from US$1,175/oz to reach a high of US$1,530/oz, a gain of 30%. The current price at the end of September is US$1,466/oz.
Chart 2: One-Year Gold Chart
Just before we get to the gold miners’ ETFs, let us have a look at the price of gold through its proxy ETF: GLD.
Chart 3: One-Year GLD ETF Chart
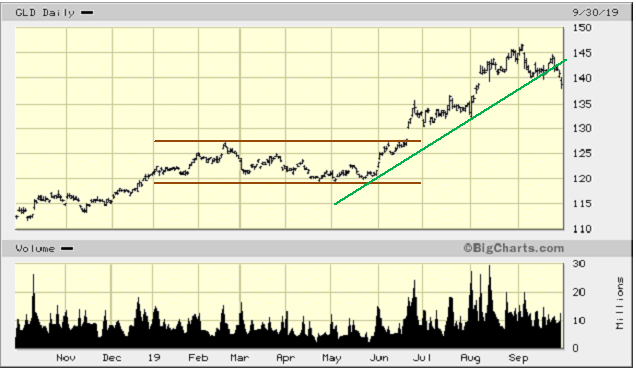
Observations: GLD has performed well lately. After being contained within the Brown rectangle for almost six months, GLD broke out and gapped higher in mid-June. However, the Green up-trend line has now been broken to the downside. This is not good. We move to the six-months charts to explain.
Chart 4: Six-Month GLD ETF Chart
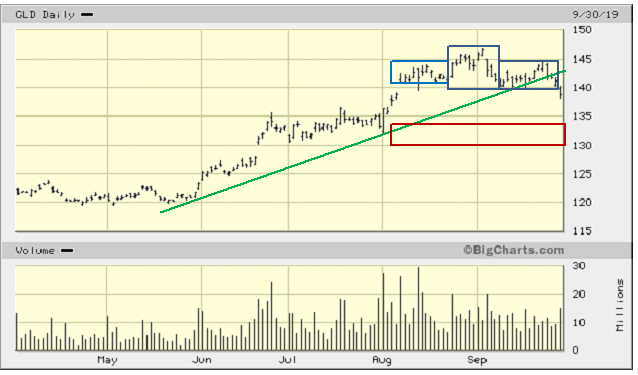
Observations: The six-month chart shows the Green up-trend line has been clearly broken to the downside. That is the first negative. Secondly, there is an ominous Head-and-Shoulders formation that has occurred, as shown by the three rectangle boxes. Arguably, this is a small-scale H&S formation. The neckline (not drawn but it would extend along the $140 mark) suggests a downward move to approximately $130-$133, as shown by the Rust rectangle box. This puts it just above the gap that marked the break-out from the elongated Brown rectangle shown in Chart 3 above. The break-down below the neckline is the second negative for the near-term gold price outlook.
Despite this impressive run in the price of gold over the past 13 months, there are also dispiriting signs creeping into the charts of the gold miners. Below we provide charts of the gold ETFs, GDX (the seniors) and GDXJ (the juniors).
Chart 5: Six-Month GDX ETF Chart
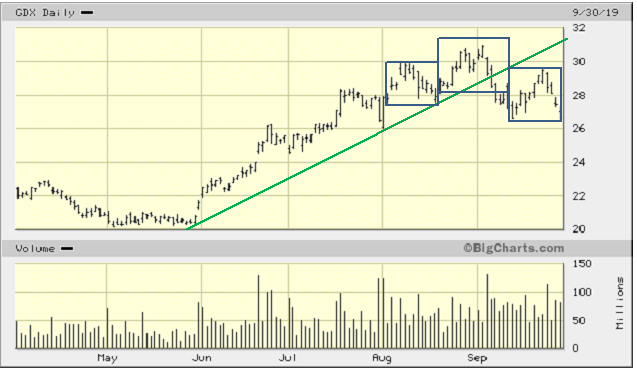
Observations: The Green up-trend line for GDX has been breached just like for GLD. Similarly, the Head & Shoulders formation shown by the three rectangular boxes also signifies that this ETF is likely headed lower. Again, the neckline has not been drawn but it is represented by the bottom of the Head at about $28.25. The GDX ETF now sits at the critical point at the bottom of the Right Shoulder. If this Support line does not hold, much lower prices for the ETF are likely.
Let us move on to the junior ETF: GDXJ. It is analyzed in the following three charts.
Chart 6A: Six-Months GDXJ ETF Chart (Up-Trend Line)
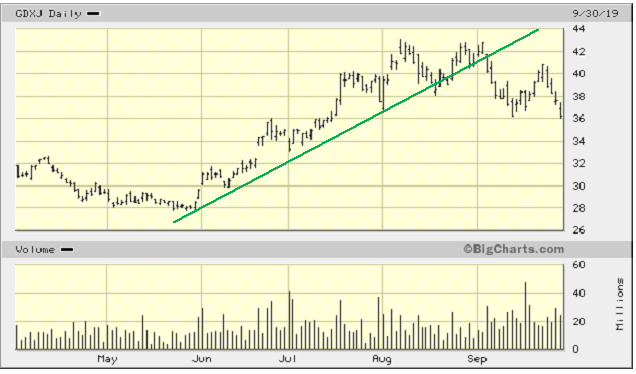
Observations: The Green up-trend line for GDXJ, just like GLD and GDX, was broken to the downside in early September. However, there is a difference in the topping process for GDXJ as distinct from GDX. The top-out could be either (1) the familiar Head & Shoulders formation, but this time with a twist: there are two Heads, or (2) a Double Top formation. We will look at these separately.
Chart 6B: Six-Months GDXJ ETF Chart (Head & Shoulders)
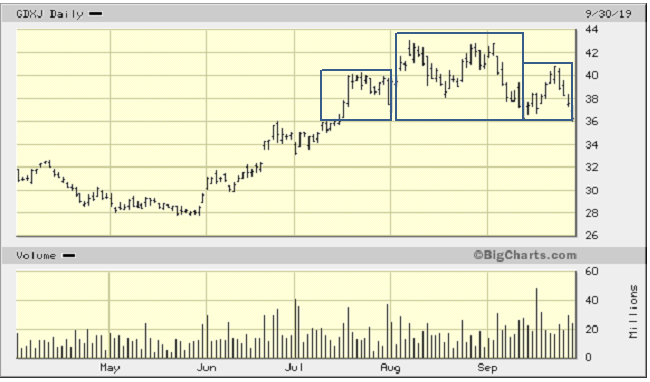
Observations: Chart 6B shows the Head & Shoulders formation for the GDXJ. The neckline (not shown) would follow along the $36 level, suggesting that the downside risk is to about $29 or where the late-May up-trend began (the Green line shown in Chart 6A).
Chart 6C: Six-Months GDXJ ETF Chart (Double Top)
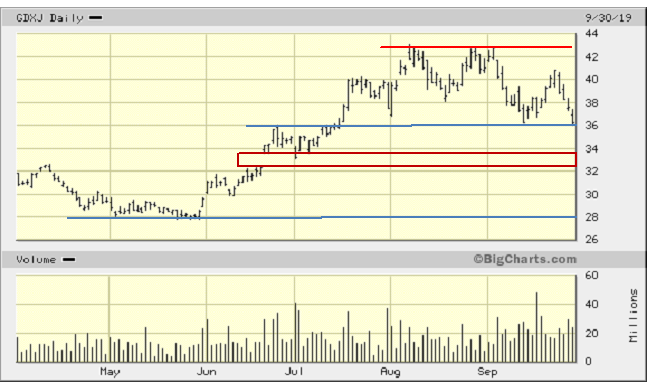
Observations: Chart 6C shows the Double Top Red line just under $43. The ETF is currently trading right at the first Support (Blue) line at $36 (down 17.7%). If it does not hold, the next level of support is provided by the Open Gap Rust rectangle between $34 and $32 (down about 24.6%). If that does not hold, the next Support level is at the second Blue line at $28 (down 36%).
Conclusion: The price of gold and its associated proxy ETFs are all sitting right now at a critical juncture.
You can read or download the report here: CotD_100119_GoldMiners