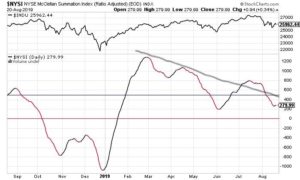
The Ratio-Adjusted Summation Index, RASI, is a market indicator developed by Tom McClellan of McClellan Financial Publications. A RASI reading that rises to and reaches a specified level (500 and above) can be a signal that a new market up-trend is starting. Conversely, a move from well above 500 down to and below 500 is a signal that the market is weakening and that it should move lower. This is the case now.

Related Articles

RASI: Index Falls Below Critical 500 Benchmark
Last week, the RASI declined below the important 500 level. This is bearish as it signals that the outlook for the stock market is Negative. Right now, the RASI and the DJIA are diverging, with the RASI declining and the DJIA rising. A divergent trend rarely lasts long. [more]

RASI Report – For August 27, 2019
eResearch is pleased to provide the Ratio-Adjusted Summation Index, the RASI Report, courtesy of McClellan Publications. The current RASI reading is 257, which is lower than last week. A reading below the benchmark 500 level is Negative, implicating negative market expectations. [more]

McClellan RASI Report – For the Week Ending July 12, 2019
eResearch is pleased to provide the Ratio-Adjusted Summation Index, the RASI Report, courtesy of McClellan Publications. This week, the RASI Index registered 782, well above the 500 mark that denotes Positive market expectations. [more]