The Chart-of-the-Day features two charts. First is a look at the various U.S. market sectors and how they have performed since the S&P 500 Index reached the 2000 mark five years ago. The second chart looks at individual companies that are the “winners” and “losers” over that time-span.
You can access the Chart-of-the-Day report at the following link: … DayChart_071119_RGMP
Bob Weir has over 50 years of investment research and analytical experience in both the equity and fixed-income sectors, and in the commercial real estate industry. He joined eResearch in 2004 and was its President, CEO, and Managing Director, Research Services until December 2018. Prior to joining eResearch, Bob was at Dominion Bond Rating Service (DBRS).
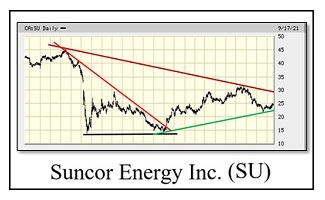
The Energy sector has not performed well over the past ten years. One of the laggards in the last few years is Suncor. This can be attributed to its almost singular focus on its oil sands projects. But, Suncor is now seriously evaluating non-fossil fuels opportunities. If Suncor can break above the Chart’s declining down trend-line, this would be very favourable for the stock, with greater expectations for further appreciation. [more]