You can access this week’s RASI Report here: … … McC_RASI_030819
McClellan Chart-In-Focus
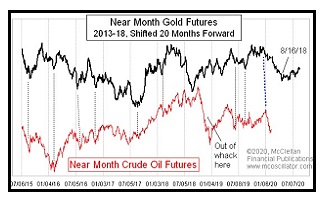
Crude Oil’s Drop Was Foretold By Gold
The latest McClellan Chart-In-Focus report from McClellan Financial Publications postulates that there is a strong relationship between movements in the price of gold and the price of crude oil. This association indicates that oil will bottom in… [more]
Analyst Articles
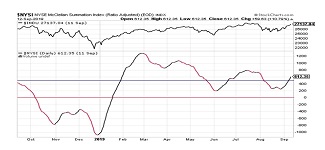
RASI: Market Outlook Positive; Trend Neutral
The RASI at the close on Thursday, September 12 is at 612, and continues to rally above the critical 500 level, which denotes the dividing line between Positive and Negative market expectation. [more]

McClellan Chart-In-Focus
U.S. Government Has a Spending Problem
The latest McClellan Chart-In-Focus report from McClellan Financial Publications shows that, provided U.S. federal tax receipts do not exceed 18% of GDP, the stock market tends to move higher. The current rate is 16% so the outlook, using this metric, remains positive. [more]