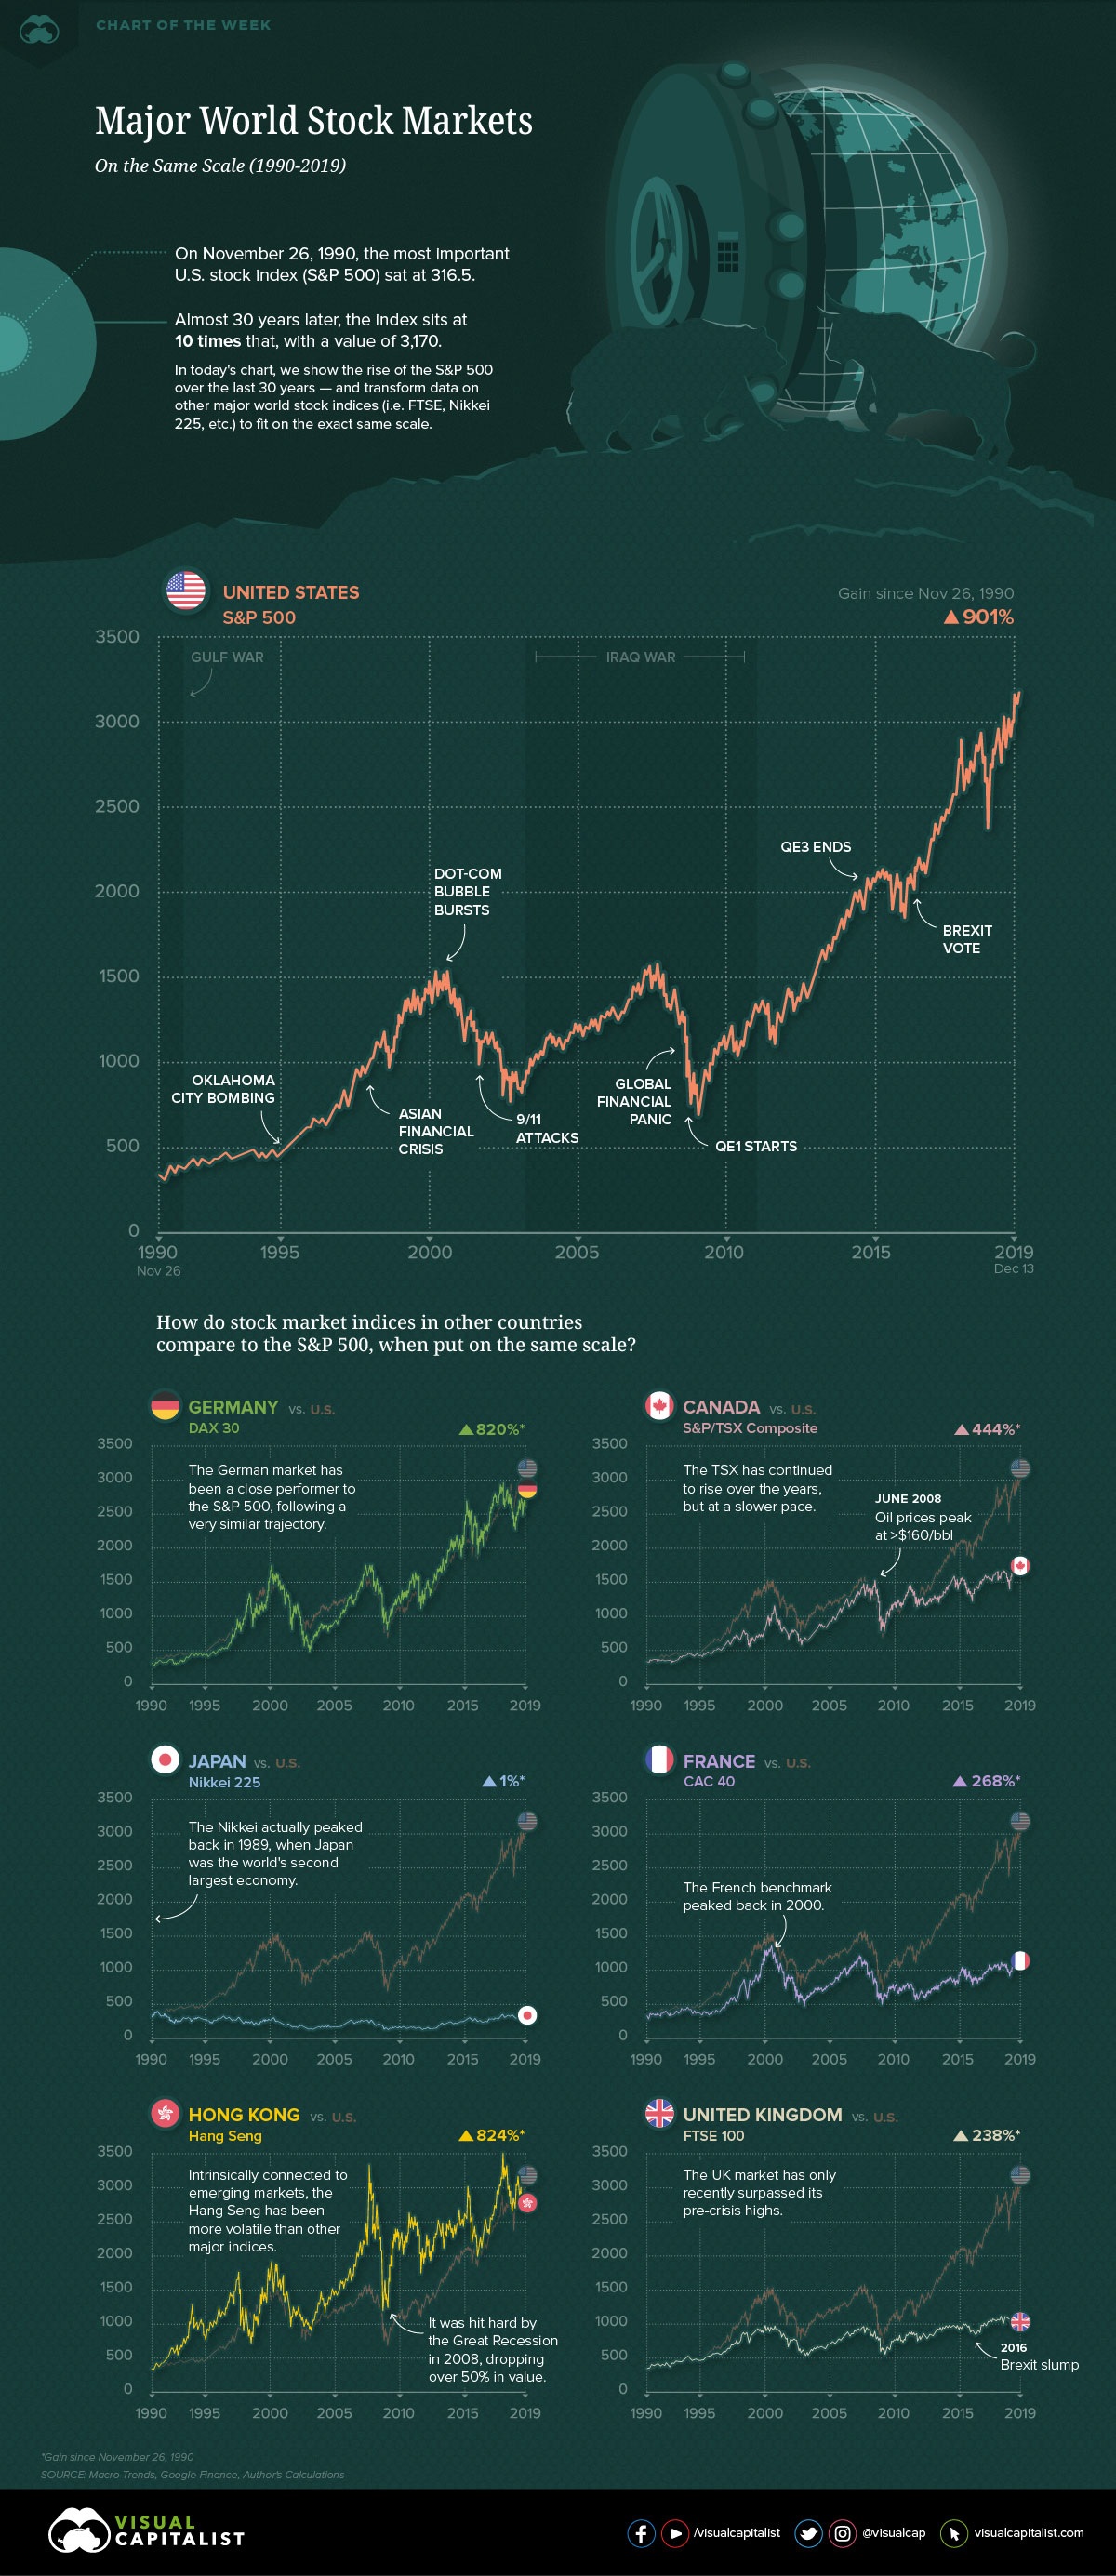
The S&P 500 is having its best December in over 5 years, closing in on the best year in over 20 years, and has increased 10 times its value since November 1990.
In a recent post “Charting the World’s Major Stock Markets on the Same Scale (1990-2019)”, Visual Capitalist charts the S&P 500 since 1990, up over 900%, and visually compares it with the major stock market indices: Hong Kong’s Hang Seng (up 824%), Germany’s DAX 30 (up 820%), Canada’s S&P/TSX Composite (up 444%), France’s CAC 40 (up 268%), UK’s FTSE 100 (up 238%) and Japan’s Nikkei 225 (up 1%).
The resulting comparisons show the recent dominance of the S&P 500, the DAX 30 and the Hang Seng indices since 1990.
Canada’s index holds its own in the next tier, up 444%, but negatively impacted by the decrease in the price of crude oil that peaked in 2008.
France’s CAC 40 peaked in 2000 and is up only 268% while UK’s FTSE 100 is up only 238% as it’s recently been in a Brexit slump.
Although the Nikkei 225 index is up over 18% this year, the index peaked at nearly 40,000 in December 1989 and is only getting back to the 1991 levels.