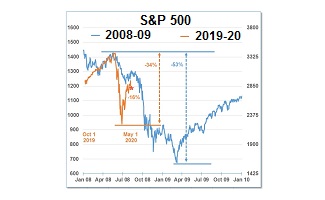
Spotlight on : S&P 500 Index
Chart #1: One-Year
Close on September 4, 2019 = 2,937.78
52-Week Hi-Lo: 3,027.98 – 2,346.58
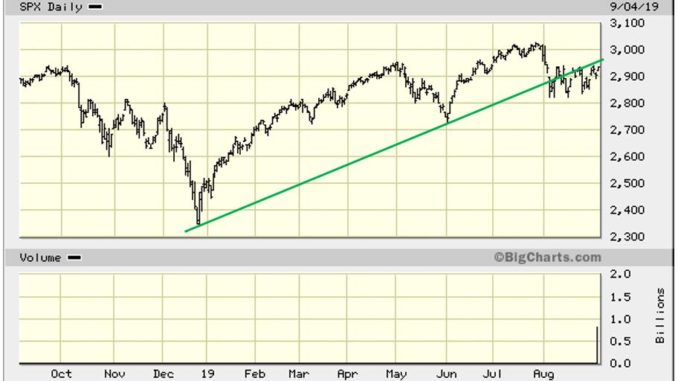
Observation: The up-trend line that began at the end of December 2018 was broken at the beginning of August when the Index gapped down. That gap was quickly filled so it is not in play. However, the Index has not been able to move sustainably above the down-trend line as it continues to nudge along the bottom of it.
Let us have a closer look at the recent price action. The chart below is for the last two months of trading.
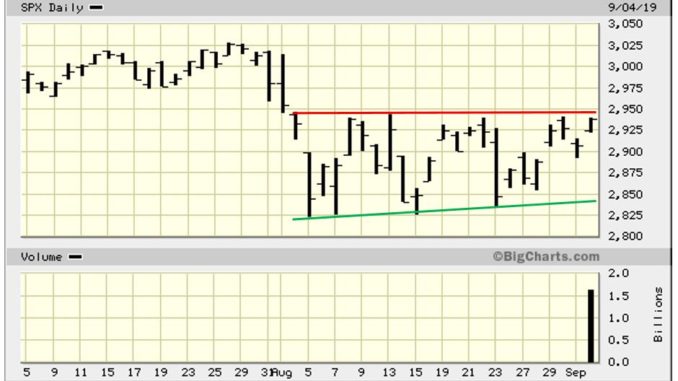
Observation: There is strong resistance at 2,945 depicted by the Red line. The slightly up-trending Green line forms a weak ascending triangle. If the Index is not able to rise above the Resistance line, then it is likely to zig-zag within the triangle until a catalyst, either positive or negative, forces it into a new trend.