eResearch | With twenty-one market indexes and market sectors losing their seasonality strength this month, it is easy to understand the significance of the traditional year-end rally. After the typically down months of September and October (2020 was no exception), November and December are traditionally strong (November 2020 was up almost 11%), and this strength continues in both January and February. March is usually problematic before giving way to the spring rally that gets underway in April.
This means that investors should normally stay in the market over the year-end. However, this year is a little different as there is likely to be a strong influence from the forth-coming change in the U.S. Administration. Normally, a switch to a Democratic Administration would be construed as a negative for the market. But, to date, since Election Day, the market has looked favourably on the in-coming Biden Administration as it is considered to offer a more stable and predictable environment. The one thing that the market hates more than anything is uncertainty. The in-coming Administration is bound to be a significant improvement in that regard.
As the U.S. governmental transition proceeds, there will be increasing clarity on the Biden Administration’s priorities. As the market digests this, the increasing transparency should provide a positive back-drop for market decision-making.
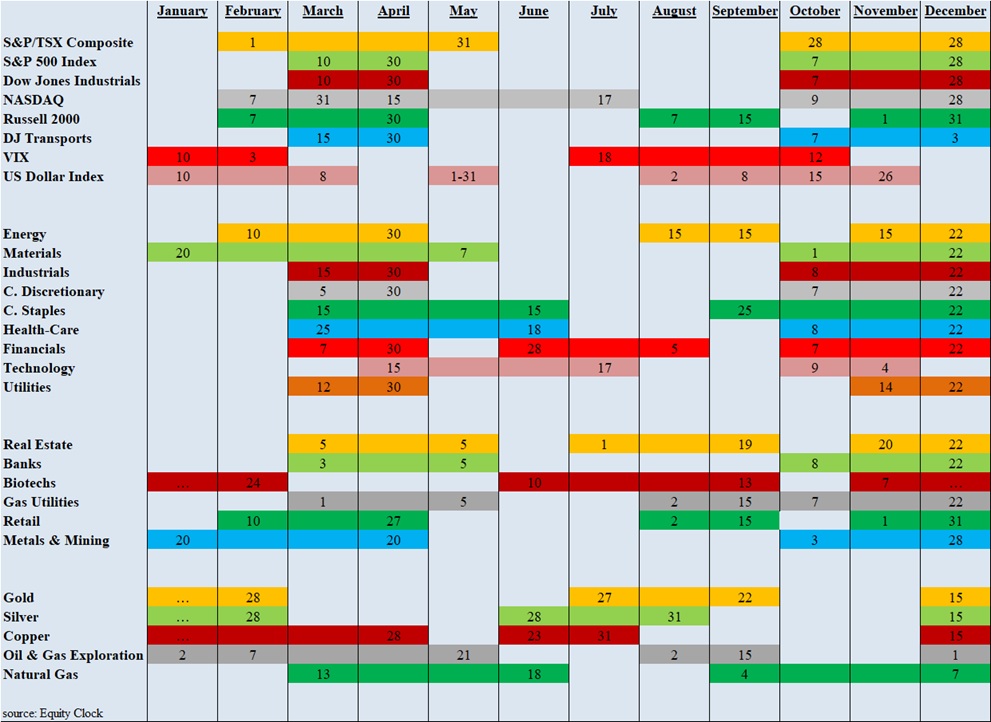
Seasonal Trends for the Market Segments in December
The following table shows which indexes and sectors are “in season” during the month of December. There are four additions this month, shown in GREEN under FROM, and twenty-one (21!!!) expiries this month, shown in RED under UNTIL.
NOTE: A full seasonality list of indexes and sectors is provided at the end of this report.
The market sectors added to the seasonality mix in December are Gold, Silver, Copper, and Oil.
CHART 1: Market Sector Changes this Month
Importance of Seasonality Trends
Utilizing the market’s historical seasonality trends can provide a useful framework for assessing and then altering the mix of one’s stock portfolio. Highly volatile markets often open up exceptional opportunities for astute investors to take advantage of market weakness to buy quality stocks that have declined in price significantly in line with the overall market downdraft. As a result, market sectors that are “in season” often provide exceptional stock-buying opportunities in such dire market conditions.
Seasonality refers to particular time-frames when stocks/sectors/indexes are subjected to and influenced by recurring tendencies that produce patterns that are apparent in the investment valuation process. A seasonality study preferably uses at least 10 years of data. Our data (courtesy of Equity Clock) is for 14 years.
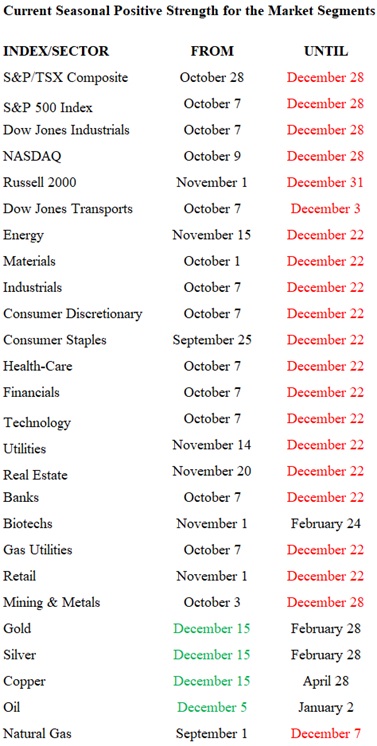
Seasonality Trends Chart
The Seasonality trends chart is an ever-changing 14-year average of the indexes and sub-indexes that we track. The charts are courtesy of www.equityclock.com.
The Seasonality Trends chart below has been updated as of December 2020. It shows the periods of seasonal strength for 28 market segments (sectors/indexes). Each bar indicates a buy and a sell date based upon the optimal holding period for each market sector/index.
CHART 2: Seasonality Trends Table