eResearch | The markets continued in their recovery mode in July, confounding many experts. Investors seem to be less concerned about the COVID-19 troubles and, instead, are focusing more on what they believe to be an economic recovery occurring on a global basis.
The Economy
In May, Canada’s GDP rose 4.5%, and expectations for June are for a further gain of around 5%. While impressive, these percentage gains are from beaten down levels that occurred in March-April. At this point, it is difficult to believe that the employment carnage and business shutterings that have occurred since the coronavirus became a major issue will not have a lasting effect on many aspects of our economy, and a direct effect on the reporting of corporate earnings (or lack thereof) over the remainder of the year.
The stock market typically looks 6-to-9 months ahead or, as a former boss used to say, “across the valley at the distant hills”. In our opinion, there are not many pundits right now who are overly optimistic 6-to-9 months out to justify the optimism being exhibited in the marketplace and, therefore, we advise caution.
On the positive side, with a concerted effort all around the world to come up with a viable vaccine for COVID-19, any break-through would likely manifest in a positive impact on market sentiment.
In these uncertain market environments, there will always be opportunities for the astute investor, and using seasonality trends can be a useful investing tool.
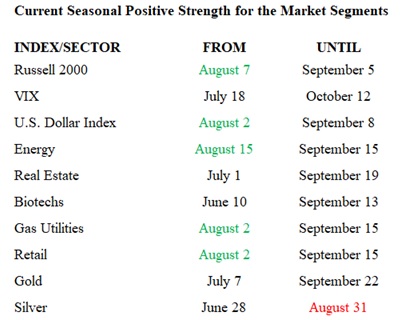
Seasonal Positive Strength for the Market Segments in July
The following table shows which indexes and sectors are “in season” during the month of August. The five dates in GREEN under FROM are this month’s additions, and the one in RED under UNTIL is this month’s expiry.
(A full list of indexes and sectors is provided at the end of this report.)
The five sectors added to the seasonality mix in August are the Russell 2000, the U.S. Dollar Index, Energy, Gas Utilities, and Retail. The single sector which ends its seasonal strength in August is Silver.
Importance of Seasonality Trends
Utilizing the market’s historical seasonality trends can provide a useful framework for assessing and then altering the mix of one’s stock portfolio. Highly volatile markets often open up exceptional opportunities for astute investors to take advantage of market weakness to buy quality stocks that have declined in price significantly in line with the overall market downdraft. As a result, market sectors that are “in season” often provide exceptional stock-buying opportunities in such dire market conditions.
Seasonality refers to particular time-frames when stocks/sectors/indexes are subjected to and influenced by recurring tendencies that produce patterns that are apparent in the investment valuation process. A seasonality study preferably uses at least 10 years of data. Our data is for 14 years.
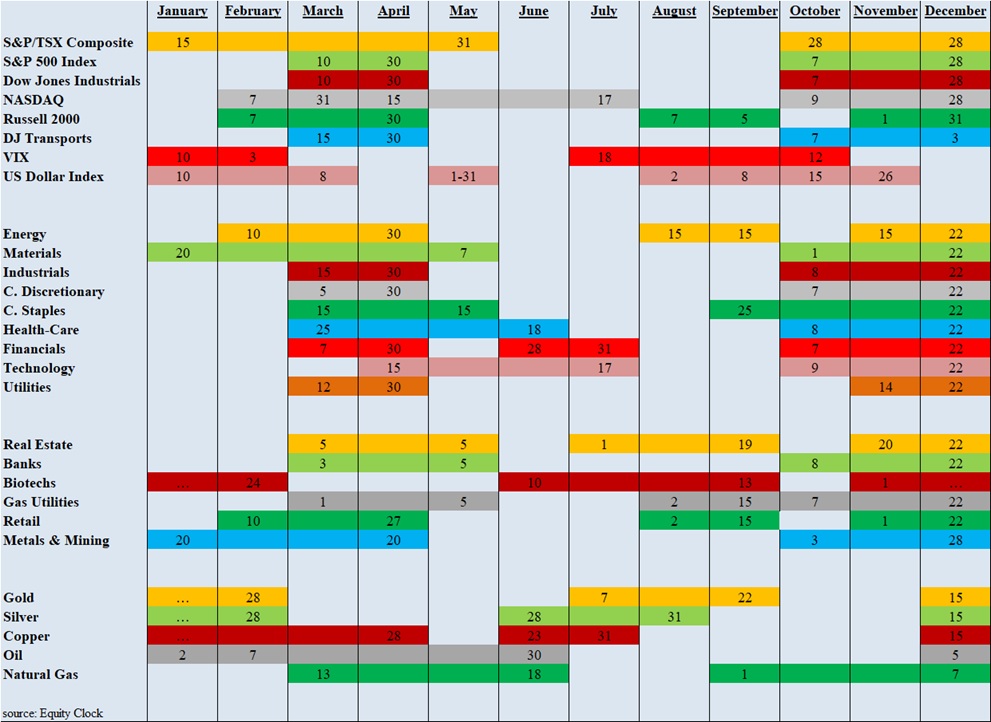
Seasonality Trends Chart
The Seasonality trends chart is an ever-changing 14-year average of the indexes and sub-indexes that we track. The charts are courtesy of www.equityclock.com.
The Seasonality Trends chart below has been updated as of May 2020. It shows the periods of seasonal strength for 28 market segments (sectors/indexes). Each bar indicates a buy and a sell date based upon the optimal holding period for each market sector/index.