eResearch | Seasonality Trends for July 2020 include the additions of Gold, Real Estate and VIX and the expiries of Copper, Financials, NASDAQ and Technology sectors.
The market see-sawed in June, rising for the first third of the month, then gapped lower, recovered briefly, then tailed off to end just slightly ahead of where it started.
The market seems to be taking its cue from expectations associated with the success, or not, of containing the COVID-19 virus. What it does not seem to be taking its cue from is the likelihood for a lengthy global economic downturn.
Economic Recession Leading to Depression?
It is a good guess that, right now, the U.S. and most of Europe, are in a recession, defined as two successive quarters of GDP decline. There is also the distinct possibility that many countries will actually enter into a depression, defined as an annual decline in GDP exceeding 10%, where such decline is calculated on a running twelve-month basis.
Such is the pressure, in every country, to end the wide-spread lock-downs, but authorities are now facing a spike in virus cases and are being forced to re-instate full or partial lock-downs once again. As the northern hemisphere enters the hottest months of the year, there is a fear that civil unrest, if not out-right anarchy, could top the headlines over the next few months. Let us hope that it does not come to that result.
So, if there is presently a disconnect between the buoyancy prevailing in the stock market and the sobering global economic outlook, when does the disconnect end and reality set in? As we have postulated in previous commentaries, the markets may yet go back to test the March lows.
In the meantime, there is a concerted effort all around the world to come up with a viable vaccine. Success in this endeavour would provide a major and likely lasting positive impact on market sentiment.
In these uncertain market environments, there will always be opportunities for the astute investor. Using seasonality trends can be a helpful investing tool.
Seasonal Positive Strength for the Market Segments in July
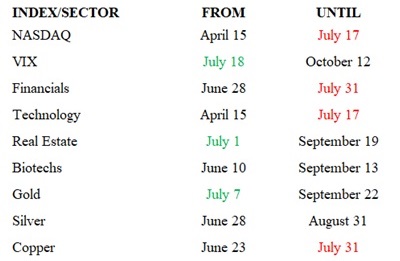
The following table shows which indexes and sectors are “in season” during the month of July. The three dates in GREEN under FROM are this month’s additions, and the four in RED under UNTIL are this month’s expiries.
(A full list of indexes and sectors is provided at the end of this report.)
The three sectors added to the seasonality mix in July are the VIX, Real Estate, and Gold. The four sectors which reach the end of their seasonal strength in July are the NASDAQ, Financials, Technology, and Copper.
TABLE 1: Current Seasonal Positive Strength for the Market Segments
Importance of Seasonality Trends
Utilizing the market’s historical seasonality trends can provide a useful framework for assessing and then altering the mix of one’s stock portfolio. Highly volatile markets often open up exceptional opportunities for astute investors to take advantage of market weakness to buy quality stocks that have declined in price significantly in line with the overall market downdraft. As a result, market sectors that are “in season” often provide exceptional stock-buying opportunities in such dire market conditions.
Seasonality refers to particular time-frames when stocks/sectors/indexes are subjected to and influenced by recurring tendencies that produce patterns that are apparent in the investment valuation process. A seasonality study preferably uses at least 10 years of data. Our data is for 14 years.
Seasonality Trends Chart
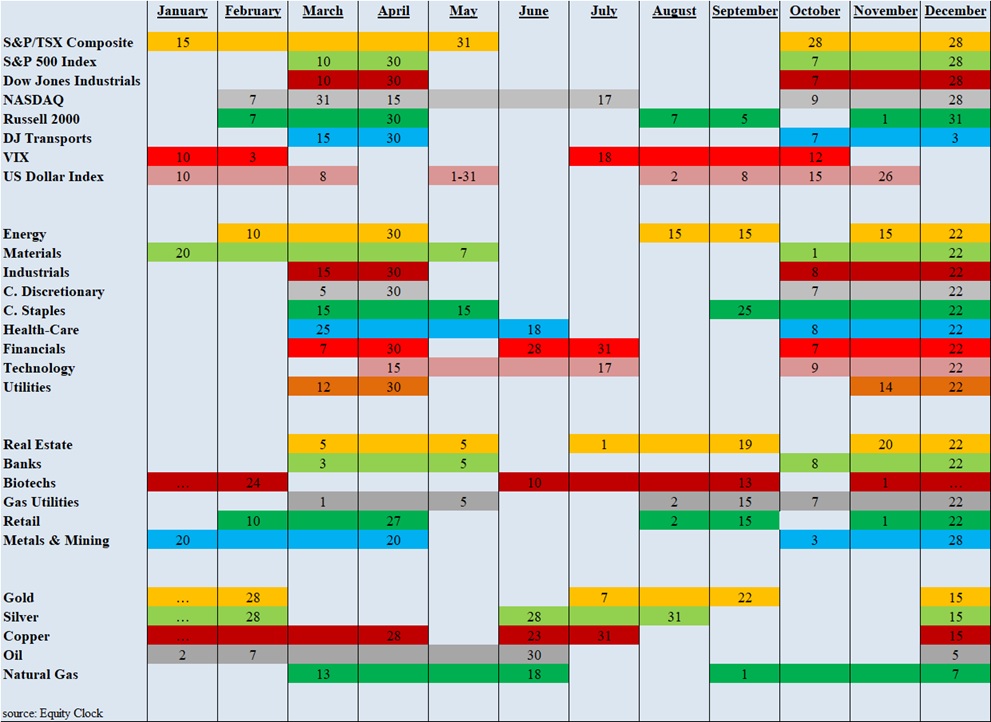
The Seasonality trends chart is an ever-changing 14-year average of the indexes and sub-indexes that we track. The charts are courtesy of www.equityclock.com.
The Seasonality Trends chart below has been updated as of May 2020. It shows the periods of seasonal strength for 28 market segments (sectors/indexes). Each bar indicates a buy and a sell date based upon the optimal holding period for each market sector/index.
//
