We continue to monitor four indicators to help guide us through these troubled times:
- CBOE Volatility Index (VIX)
- S&P 500 Chart of the 2008-2009 Recession with today’s S&P 500 mapped over it.
- S. Coronavirus New Cases
- S. Seasonally Adjusted Weekly Unemployment Claims
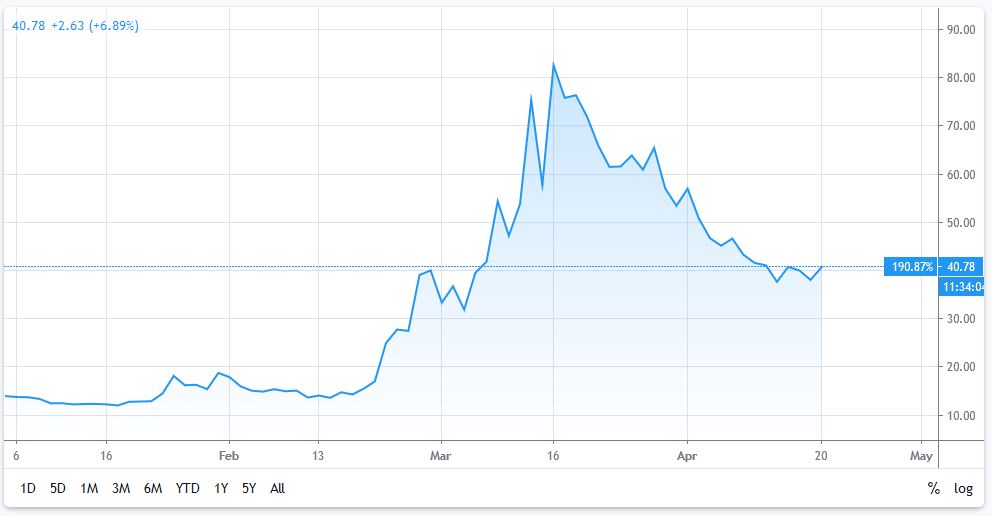
1) VIX: S&P 500 Market Volatility Index
| This week: 38.2 | Last week: 41.7 | 2 weeks ago: 46.8 | 3 weeks ago: 65.5 |
| Remains in the “High Volatility” range. | |||
| Why it is important: The VIX index measures the market’s expectation for the 30-day forward-looking volatility and is derived from the S&P 500 index options. | |||
| Below 12: Low volatility | 12 to 20: Normal volatility | Above 20: High volatility | |
CHART 1: VIX Index Chart – Year-to-Date – Currently at 38.2 Down from 41.7 Last Week
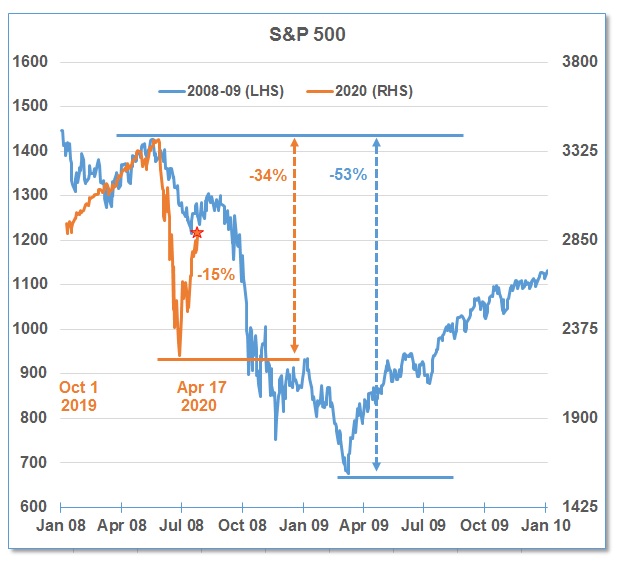
2) S&P 500 Chart
The North American indices continued to advance higher last week and politicians focused on the coronavirus “peaks” and the plan for the gradual re-start of the economy. In the chart below, we have overlaid the stock market since October 2019 on top of the stock market during 2008-09 during the financial crisis.
- The S&P 500 advanced higher by 3% last week and is at 2875, down 15% from the high of 3386.15 on February 19.
- At the recent bottom, the S&P 500 was down almost 34% from its peak in February.
- During the 2008-09 Financial Crisis recession, the S&P 500 dropped 53%.
- There is concern about the potential for another drop once the true effects on the economy are felt.
CHART 2: Current S&P 500 Index Mapped Over the Chart of the S&P 500 from 2008-2009
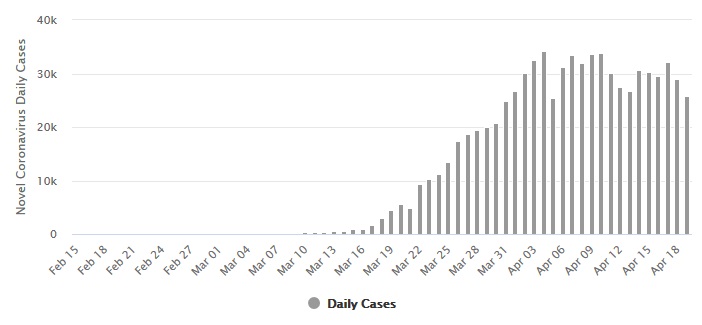
3) U.S. New Coronavirus Cases
The number of daily new cases in the United States peak around April 3 at over 34,000 cases reported per day and, on April 19, approximately 26,000 new cases were reported.
However, the U.S. is now the country with the highest number of coronavirus-related deaths, recording 40,565, and almost doubling the amount week-over-week.
With 99% of Americans under some sort of stay-at-home order, the negative economic impact will continue, however the U.S. president last week outlined the criteria for the re-start of the U.S. economy and there is a strong push to re-open by May 1.
CHART 3: Daily New Cases of COVID-19 in the United States
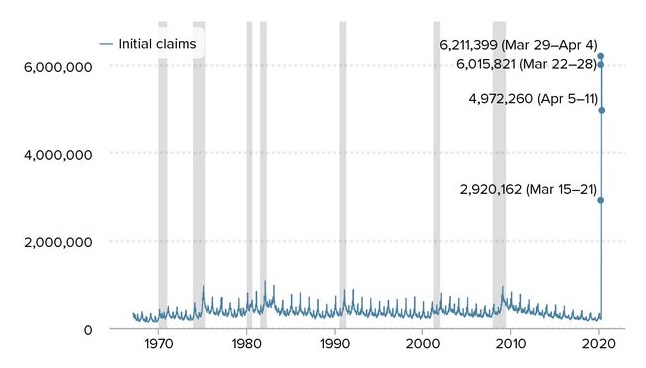
4) U.S. Seasonally Adjusted Weekly Unemployment Claims
Last week, 4,972,260 Americans applied for unemployment benefits as the widespread layoffs caused by the COVID-19 pandemic crisis continued.
This amount is lower than 6,606,000, from the previous week. Unemployment claims peaked at over 6.2 million for the March 29 – April 4 period.
The recent four-week total is now at over 21.75 million. The continued surge in new unemployment claims was not a surprise as stay-at-home measures now reached 99% of Americans and Canadians. As previously noted, some economists expected 15-25 million Americans would likely be laid off or furloughed before the economy recovers from the coronavirus impact.
CHART 4: U.S. Seasonally Adjusted Weekly Unemployment Claims
//