eResearch | Utilizing the market’s historical seasonality trends can provide a useful framework for assessing and then altering the mix of one’s stock portfolio. Highly volatile markets often open up exceptional opportunities for astute investors to take advantage of market weakness to buy quality stocks that have declined in price significantly in line with the overall market downdraft. As a result, market sectors that are “in season” often provide exceptional stock-buying opportunities in such dire market conditions.
Seasonal Positive Strength for the Market Segments in April
The following table shows which indexes and sectors are “in season” during the month of April. The dates in GREEN under FROM are this month’s additions, and the ones in RED under UNTIL are this month’s expiries.
| INDEX/SECTOR | FROM | UNTIL |
| S&P/TSX Composite | October 28 | June 5 |
| S&P 500 Index | October 28 | May 5 |
| Dow Jones Industrials | October 28 | May 17 |
| NASDAQ | April 15 | July 17 |
| Russell 2000 | February 1 | April 30 |
| DJ Transports | February 3 | April 16 |
| Energy | February 1 | April 30 |
| Consumer Discretionary | February 10 | April 30 |
| Materials | January 20 | May 5 |
| Industrials | March 1 | May 5 |
| Consumer Staples | March 12 | May 31 |
| Health-Care | March 5 | July 17 |
| Financials | March 1 | April 30 |
| Technology | April 15 | July 17 |
| Utilities | March 12 | April 30 |
| Real Estate | January 20 | May 5 |
| Banks | February 21 | April 30 |
| Gas Utilities | March 1 | May 9 |
| Retail | January 18 | April 27 |
| Metals & Mining | January 20 | May 5 |
| Copper | December 15 | April 28 |
| Oil | February 7 | September 22 |
| Natural Gas | March 13 | June 18 |
Source: Equity Clock and eResearch Corp.
Changes for April
There are two sectors added to the seasonality mix in April, and they are the NASDAQ and Technology. Nine sectors reach the end of their seasonal strength in April, and they are Russel 2000, DJ Transports, Energy, Consumer Discretionary, Financials, Utilities, Banks, Retail, and Copper.
Importance of Seasonality Trends
Seasonality refers to particular time-frames when stocks/sectors/indexes are subjected to and influenced by recurring tendencies that produce patterns that are apparent in the investment valuation process. A seasonality study preferably uses at least 10 years of data.
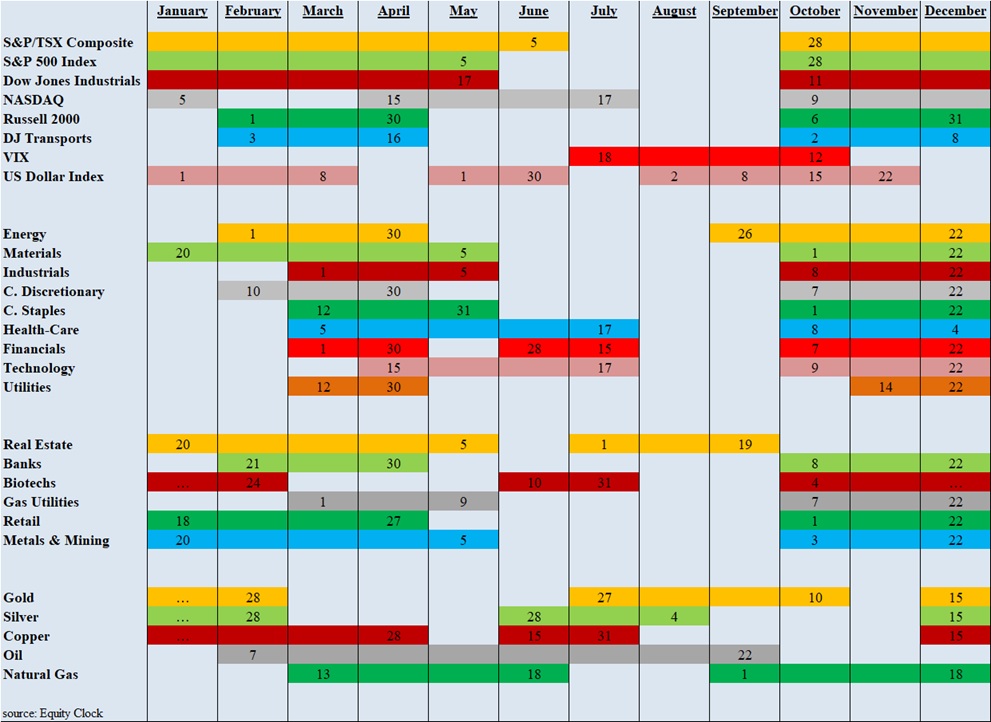
Seasonality Trends Chart
The Seasonality Trends chart below shows the periods of seasonal strength for 28 market segments (sectors/indexes). Each bar indicates a buy and a sell date based upon the optimal holding period for each market sector/index.
//
