eResearch | Today’s article from Chris Kimble is about the relationship of certain related assets and, specifically, the spread between the Gold/Silver Miners Index (symbol XAU) and gold prices.
When the prices of related assets become too wide, there is a strong tendency for the prices of these assets to carry out a reversion to the mean.
In such cases, this reversion can provide investors with exceptional profit opportunities.
The following chart shows that the spread between the XAU and the price of gold is the widest it has been in years.
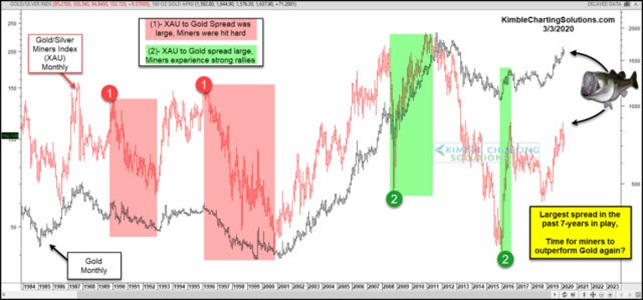
When XAU (i.e., the mining stocks) is out-performing Gold and the spread is wide (at each 1 on the chart), the miners tend to under-perform the price of gold.
However, when the miners are under-performing and the spread is wide (like it is now), the potential is there for the miners to play catch-up. The last two times this took place at each (2 on the chart), the mining stocks did very well.
The XAU index is facing peaks that took place in 2013 and 2016. From a technical perspective, until these former highs are broken to the upside, they act as strong resistance.
If the XAU index does break out, a rally could follow. This could be an opportunistic time to speculate in gold mining shares, so keep them on your radar screen!
To see the XAU Index, click here: Gold/Silver Miners Index (XAU)
//